TechChange alumni are always doing amazing things. They have launched mHealth apps to help with HIV prescriptions in South Africa, started mapping projects for maternal health in Ghana and more. Today, we feature an alumna from our Mapping for International Development course, Dominique Narciso!

Since taking our course last year, Dominique has gone on to found her own mapping platform, AidWell. We caught up with Dominique to hear more:

Tell us about AidWell
D: AidWell is a crowdsourced mapping and collaboration platform that would make it easy and simple to know the development stakeholders within a given issue area, such as youth development or water.

What inspired you to start AidWell?
D: During my time at Georgetown’s Master of Science in Foreign Service Program, I began to see the emerging trends in international development, where new players were growing in influence and new types of innovations were being implemented across the globe. I thought to myself, what if there was a way to see how all of these organizations are connected, visually?

Then I took TechChange’s Mapping for International Development course and really saw the possibility of visualizing this information, which pushed me further to make AidWell a reality.

Why a mapping platform?
D: If you are looking to learn about what issues different organizations are working on today, there is currently no mapping tool that consolidates this type of information in an easy and user-friendly way. Right now, it is a tedious process to find that out; you may do some google searches, reach out to your networks, or laboriously look at some NGO directories.

AidWell steps in to make it easier to just see it all in one platform on a map. It would serve US-based organizations looking to make connections with local development stakeholders and for in-country organizations looking to collaborate and learn from one another.

Dom with her team Dominique with her AidWell team

Where is AidWell right now?
D: Since starting-up, I’ve conducted a multitude of informational interviews with international NGOs, foundations, social enterprises, and donors to learn more about the need and potential viability of a mapping platform. Currently, our small AidWell team is conducting mini-experiments to understand demand and pinpoint the major challenges faced by potential users, when looking for local information of organizations.

Where do you see AidWell in a few years?
D: My vision for AidWell is to create the leading stakeholder mapping platform for the international development field, a mapping platform that opens up the possibilities for new connections and innovative ways for sharing knowledge. In the next 3-6 months, the AidWell team will be working on proving the concept, building a minimum viable product, and testing the platform in three pilot countries.

Some potential uses for this platform would include:

  • A first stop for program designers and donors when gathering information to design partnerships, cross-sector collaborations, or collective impact strategies
  • A resource for local organizations to see who is working on the same issues in their country, and potentially a virtual space for collaboration and learning
  • A country stakeholder map service for grantmakers and implementing organizations, that inform funding and stakeholder engagement strategies

Where does AidWell fit in the bigger picture?
D: With the Sustainable Development Goals being released the end of this year, there has been lots of conversations around cross-sector collaboration and public-private partnerships. One goal that stands out in this sentiment is Goal 17: ‘Strengthen the means of implementation and revitalize the global partnership for sustainable development.’

This one goal is a sign that the way development is being done will continually change, as we reimagine the way organizations work with one another, how knowledge is shared across sectors and across borders, and how unlikely players can contribute to innovative approaches for development. I believe AidWell can be a part of this bigger goal, by helping organizations make that first step in knowing and engaging with the right organizations from day one.

Check out Dominique’s platform, AidWell here. If you would like to help with AidWell’s research and/or share ideas on mapping, please get in touch with Dom at dnarciso@AidWell.org with the title ‘TechChange: AidWell Suggestion.’

Interested in learning more about how mapping can impact social good, check out our upcoming course on Mapping for Social Good that begins on October 26, 2015.

About Dominique
dom26
Dominique Narciso is a skilled relationship builder, creative implementer, and forward-thinking leader in the international development space. She has over eight years of experience working on community development initiatives, social enterprise, and economic development. She is the Founder of AidWell, a start-up organization working to catalyze cross-sector collaboration through a web-based mapping platform to connect and map out players in the development space. She worked at Social Impact as a Business Development Manager, designing their international processes for future business opportunities. During her service as a Peace Corps Volunteer in Costa Rica, she co-designed several youth, women, and economic development initiatives with community members and local leaders. She has a Master’s of Science in Foreign Service from Georgetown University and a dual BA from UCLA in Communication Studies and Women’s Studies.

Featured Image: Gardens for Health International’s agricultural agents complete a mental mapping exercise in Ndera, Rwanda.

At Broad Street Maps, we believe that health is inherently a geographic issue. In the U.S. today, your zip code is a better predictor of your health profile than your genetic code. And in much of the developing world, where resources and infrastructure are limited, physical access to primary care can be the single most determining factor in the utilization of health services, and consequently, the health of a population. Therefore, the majority of the problems health workers face in these countries on a daily basis are inherently spatial. Resolving concerns about access to services and coverage, allocating limited resources effectively, and understanding the distribution of phenomena across a catchment area all depend on geographic knowledge.

The strength of local public health systems is inextricably linked to basic infrastructure. And being able to visualize that system as a whole — one made up of health centers and hospitals, water wells, bus stops, and marketplaces — is essential for delivering services to where they are needed the most.

Maps were used in public health since the 1800s

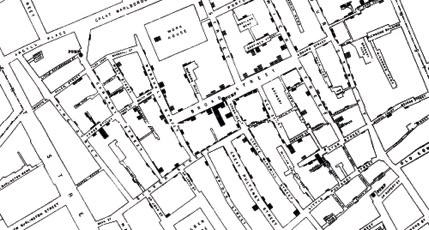
More than 150 years ago, Dr. John Snow, the father of modern epidemiology, and local community leader Reverend Henry Whitehead set out to investigate the cause of London’s raging cholera epidemic. The duo conducted interviews and gathered data points, going door-to-door to track the source of the epidemic. As their research progressed, Snow decided to map of the distribution of deaths in relation to Soho’s water sources. The map showed a trend — many of the deaths occurred around the Broad Street water pump or around businesses that used the pump’s water. Bolstered by his visualization, Snow insisted that the city remove the handle of the pump. After the pump was removed, mortality declined rapidly, forcing the medical community to consider, for the first time, the waterborne nature of the disease. Dr. Snow’s actions not only saved hundreds of lives, they also marked the first time that maps were used to directly influence public health policy.

Broad_Street
Snow, J. On the Mode of Communication of Cholera, 2nd Edition, 1855.

Opportunities and Challenges in public health mapping today

Today, maps and geographic analysis are being utilized in a myriad of ways across public health. They have, for example, been used to record distances that patients have to travel to get to the nearest tuberculosis directly observed treatment (DOT) distribution points, to quantify a relationship between the accessibility to roads and HIV cases, calculate population per bed ratios at local clinics, spatially analyze clinic usage, and evaluate and improve ambulance response times.

But despite their proven value, geographic tools remain extremely underutilized in the field of public health. Anyone who has ever interacted with a geographic information system (GIS) can probably guess why. The software is incredibly complex and time-intensive. It requires either a trained staff member or a significant investment in consultation. And most significantly in the developing world, it requires complete and accurate geographic data.

GQIS
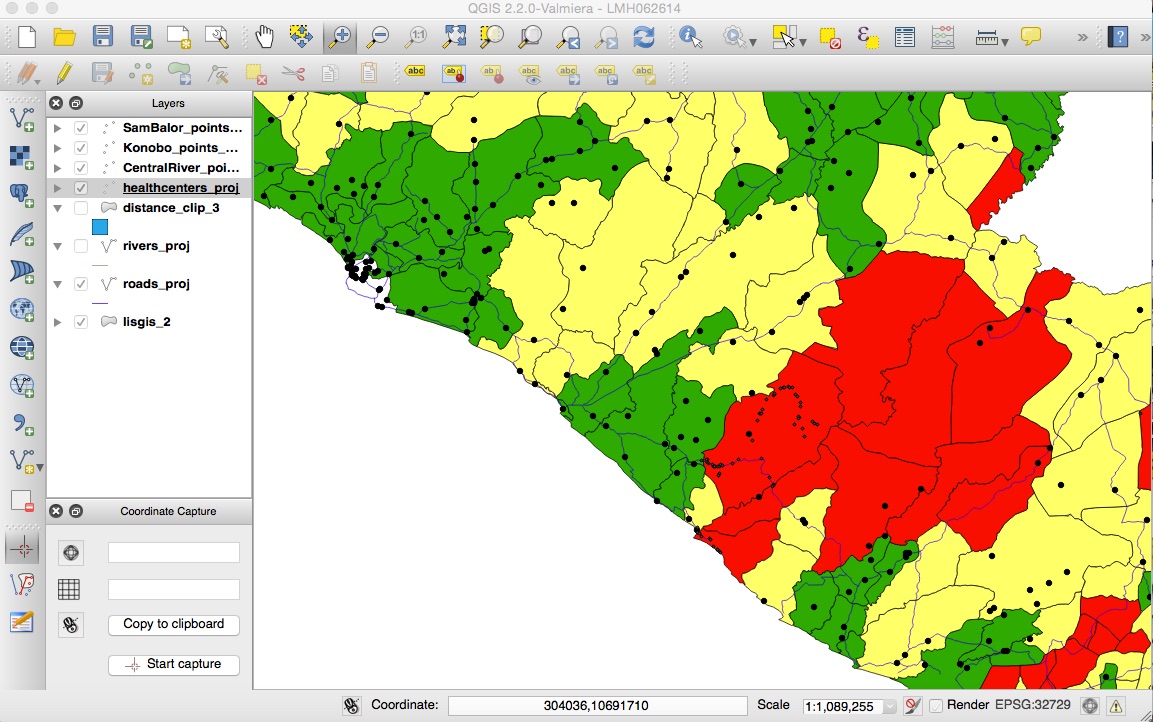
Analysis of the distribution of health centers performed in QGIS

Luckily, the proliferation of GPS-enabled smartphones is beginning to simplify the process of collecting and building upon this fledgling geographic data infrastructure. Tools like Magpi and ODK Collect allow users to update health surveys with the simple addition of a ‘Location’ field, thereby putting in place the essential building blocks for geographic analysis without exorbitant time, training, or cost. At the same time, Quantum GIS (QGIS) is offering a free and open source alternative to the close-source giants. And new platforms like CartoDB are making game-changing strides towards making web maps and geographic analysis more accessible.

But possibly the biggest obstacle to adopting these tools is a lack of roadmap on how to truly integrate geographic analysis into existing workflows. Smaller-scale organizations with limited bandwidth don’t have time to invest in new systems that don’t directly make their lives easier. Far too much ICT4D ends up being a burden. What we need are tools that streamline the process of analysis to decision-making. What we need are maps for action.

A Place to Start

Fortunately, organizations do not necessarily need to dive into software licenses and new tech to begin making action-oriented, spatial decisions. Hand-drawn maps have proven to be incredibly valuable tools for incorporating local knowledge, enhancing community ownership, and understanding local perceptions of distance and space. As Dr. John Snow and Reverend Henry Whitehead demonstrated, visualizing pertinent health data in even the simplest ways can elicit valuable new insights that inform future decision-making. And maybe even more importantly, the duo also proved that the grassroots process involved in understanding your “where” can be essential to developing a sound, and possibly life-saving, theory of “why.”

Peru_house_visit
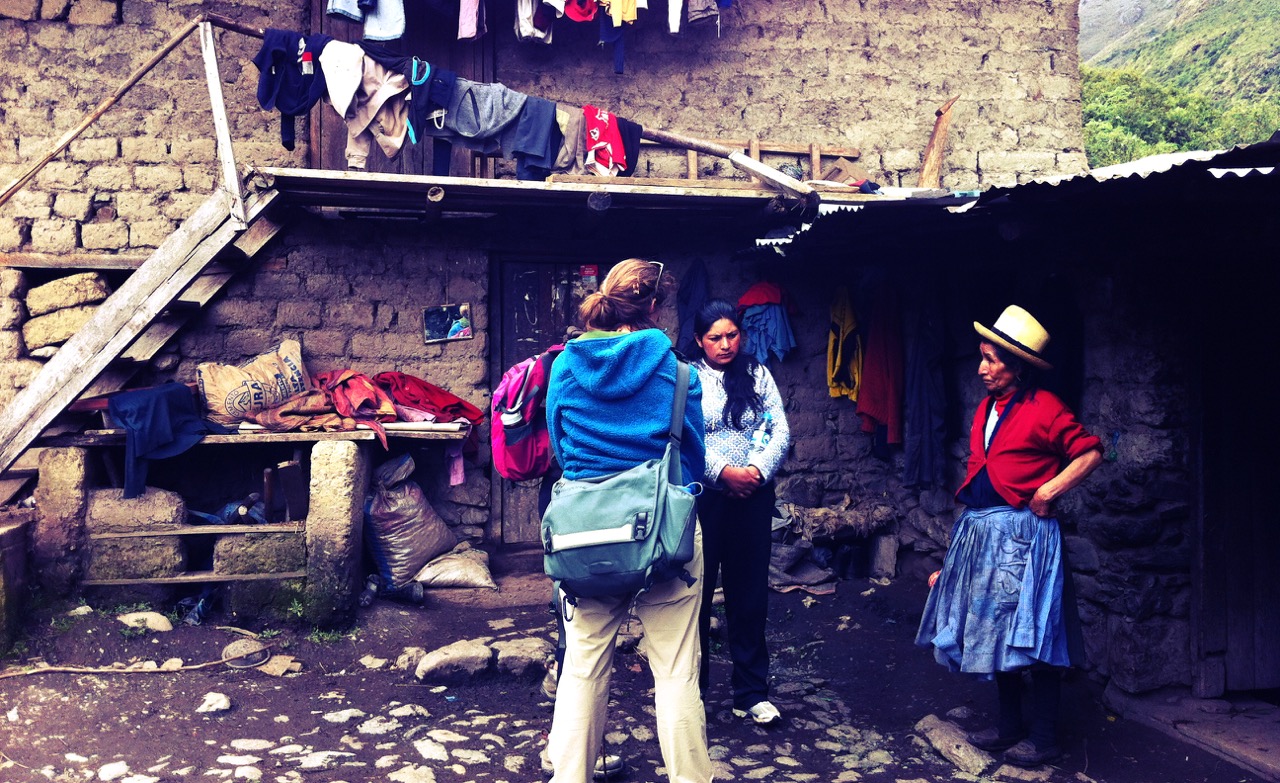
Broad Street Maps helping to conduct a household survey and collect GPS locations of patients in the Sacred Valley of Peru

Inspired by both the lessons from London and our time in the field, our team at Broad Street Maps is committed to leveraging the power of maps to visualize information, identify patterns, and, above all, actively use this vital perspective to make decisions.

If you are interested in learning more, have any questions, or are just head over heels about maps, please shoot us a line at contact@broadstreetmaps.org. Our team is always happy to provide guidance to organizations interested in mapping at all stages of the process.

If you are passionate about mapping development data, take a moment to check out the incredible work being done in the OpenStreetMap, the Humanitarian OpenStreetMap, and the Missing Maps communities.

And lastly, for a true immersion experience, be sure to check out TechChange’s course on Mapping for Social Good. Course starts this week!

About Isabel
isabel
Isabel Shaw heads cartography and product development at Broad Street Maps. She has worked with Save the Children and National Geographic and lived in Rwanda and Argentina. She is a TechChange alumna and holds a BA in Geography with concentrations in Global Health and Spanish from Middlebury College. Shaw lives in Seattle, WA.

What does urban design have to do with mental health? By 2050, at least two-thirds of the global population will live in cities, which means urban public health is fast becoming a priority. Policymakers, architects, designers, urban planners and others are starting to think seriously about how to design our cities in ways that reduce health issues like obesity or breathing problems, but one key aspect of urban public health can find itself under the opportunity radar: mental health.

The Centre for Urban Design and Mental Health (UD/MH) hopes to change this. Launching this week in Washington DC, this startup think tank seeks to answer one question: how can we design better mental health into our cities? UD/MH plans to bring together interdisciplinary thinkers and doers to share ideas and find solutions. They will curate research, provide analysis, showcase innovation and host interdisciplinary dialogues in cities all over the world.

UD/MH

We know cities can make us happy. For example, they can facilitate social interaction, deliver low-stress commutes, and may provide us with lovely green spaces. But we also know that cities can also make us less than happy. City living is associated with increased depression, anxiety, and even schizophrenia.

Can we adapt the urban environment to improve our mental health and wellbeing? And how can mobile technology help?

Right now, mHealth is emerging as a promising tool to help us understand how urban design affects mental wellbeing. The Urban Mind Project is a current London-based pilot research project that invites people to regularly track their mental wellbeing over the course of a week via a mobile app, which relates their feelings to different aspects of the urban environment. The researchers hope their results will inform future urban planning and social policy on urban design and mental health.

“We can use digital technologies to try to understand how the built environment affects us, affects our well-being and our health, and maybe it sounds a bit too optimistic, but I think it must be possible to build better environments,” says Andrea Mechelli, the lead investigator on the study. “It seems an obvious thing to do, but it’s not really happening. Often, urban planning is motivated by other reasons. Why should it not be motivated by people’s well being and health?”

The Urban Mind Project is a collaboration between King’s College London, J&L Gibbons, Nomad, A&E, the Van Alen Institute and the Sustainable Society Network+. They aim to analyze the data and demonstrate how urban environments affect mental health. One example is looking at the way urban environments can influence whether a person is more or less likely to develop an addiction. If you happen to be in London, you can sign up to participate here.

Screen shot: Urban Mind Project

Screen shot: Urban Mind Project

If you’re not in London, you will soon be able to start tracking urban design and mental health via your phone using Gensler’s new PoppySeed app. PoppySeed plans to crowdsource how different city locations make people feel, and direct them to locations that others associate with positive emotions. The data being gathered by this app is also poised to feed into future decision-making around urban design. Right now, you still need an invitation code to join the fun but here’s a video that gives an overview of the app. mHealth for urban design and mental health is in its infancy, but it is growing and this is an exciting time.

As the Centre for Urban Design and Mental Health gets underway, we can look forward to the results of these experiments, and to others sharing their innovative mHealth projects on the think tank’s Sanity and Urbanity blog. In the meantime, other ways in which urban design can improve mental health will be explored at the UD/MH launch event on July 7th. A limited number of tickets are still available here.

Interested in learning more? We will be exploring initiatives like UD/MH in our upcoming Mapping for Social Good online course that begins on July 20. 

About Layla

Layla McCay

Layla McCay, a TechChange mHealth alumna is a psychiatrist, health policy specialist, and adjunct professor in international health at Georgetown University. Trained at the Maudsley Hospital and Institute of Psychiatry in London, she has worked for the World Health Organization, the World Bank, and several global health NGOs. She is passionate about the determinants of mental health and how people interact with the built environment. Layla is the Director of the Centre for Urban Design and Mental Health, launching on July 7.

Today, we’re excited to share an interview with TechChange alum Ladislas Hibusu! Ladislas has completed 5 courses and is currently taking his sixth. Learn more about his journey and how TechChange has impacted his career below.

1.  What got you interested in taking TechChange courses?

I first heard of TechChange from a colleague who was a TechChange alum. At the time, I was grappling to understand my new role as a Global Health Corps (GHC) fellow at a local NGO that was dealing with behavior change. My new position meant that I had to have certain skill sets if I were to succeed. It was around that time that my colleague shared TechChange’s TC111: Technology for Monitoring and Evaluation course. After reviewing the course content, I jumped at the opportunity to sign-up.

2.  After completing your first course with TechChange, what made you enroll in more courses?
After taking TC111: Technology for Monitoring and Evaluation, I was particularly fascinated with the themes, exercises, case studies, featured articles and reading materials but most importantly the top-notch industry experts from the live sessions who provided great insight on real-time trends. The recorded videos have also been a useful tool for expounding on themes such as mHealth, mAgric, mEducation, mFinance and other topics. The industry experts such as Joel Selaniko gave great insight into their area of expertise. However, TechChange facilitators like Norman, Kendra and Jennifer will tell you that what I am particularly passionate about are the great tech tools and platforms that are a big piece of the course. The unique nature of the tools and the way the recorded and live demos are presented is something anyone wanting to go further in their career could not resist.
I have positioned myself as a competitive data engineer not with a degree in an engineering field, but with the willingness to learn and lean on the shoulders of the experts that these TechChange courses have introduced me to.

3.  How have TechChange courses impacted your career?
The most significant impact that TechChange courses have offered me are the skills that have translated into making me competitive in the job market. While taking TC111, I was engaged as a Data Quality Consultant in an end-line evaluation of the project impact. Immediately after, I was hired as an independent Technical Monitoring and Evaluation consultant with two reputable international NGOs. Sooner rather than later, all I will need in my work life will be my eyes, head, hands, a mobile phone, laptop with Internet connectivity and the appropriate state of the art software. I will have earned my reputation of “getting jobs done” beyond the hire’s expectation.

4.  What is your advice for other participants taking a TechChange course? How can they get the most out of it?

Research broadly: Go beyond the course content, especially in their areas of interest, as this will enable them to know exactly what to ask from the expert speakers in order to get the maximum benefit.

Utilize the networks/connections: TechChange connects us to global experts and thought leaders in their own areas. For instance, I found that the project that one of the experts and TechChange alum Mira Gupta was working on was similar to what initially drove me into taking the TechChange courses. Engage with other participants too as they have a wealth of experience on this topic. I have received valuable resources out of the TechChange platform from the colleagues I met via the courses, which have been a great boost to my career.

————————————-

About Ladislas

Ladislas Headshot

Ladislas Hibusu is a researcher and a Monitoring and Evaluation consultant. Over the years, he has come to love making research inquiries and helping students and companies on baseline, mid-line and end-line evaluation of their project impacts. He has also worked on the technology side of data documentation. Before working with Jhpiego as a consultant, he was a Global Health Corps fellow in the 2013/14 year and also consulted with Futures Group Global Inc. as a Data Quality Consultant. After receiving his college degree in Library and Information Studies and Demography, he spent time working as a Librarian and life coach at an organization that helps orphaned and vulnerable children realize their dreams. Ladislas can be found on Twitter at @tracykhibusu

————————————-

How has TechChange’s course affected your career? We would love to hear your story too! Reach out to us at info@techchange.org

Photo credit: myAgro

The current financial model of banks cannot address what development experts call the “triple whammy” of poor peoples’ lives – they struggle with low savings, uncertainty of cash flows, and the inability to access formal financial instruments. Small farm holders in the developing world face similar struggles as they often have to purchase seeds and fertilizers in one large payment to improve their harvest. MyAgro, provides an innovative alternative to farmers, eliminating the need for banks and placing financial decision-making in the hands of small farm holders.

MyAgro helps farmers purchase agricultural tools on layaway via an SMS platform and a network of local vendors. Anushka Ratnayake started myAgro in 2011 as a pilot program in Mali and soon expanded it to Senegal. MyAgro’s success can be attributed to their approach of using a mobile phone platform to adapt current pro-poor financial methods to addressing the financing problem in the agricultural sector.

How does myAgro work?
MyAgro works much like someone going to top up their phone for additional talk time at their local store. Participating farmers purchase scratch-off cards (ranging from $.50 to $10) with a unique pin number. This pin number is sent to myAgro and is recorded in their database under the farmer’s profile. An SMS is sent back to the farmer notifying them of how much they have saved towards their goal (to purchase fertilizer, seeds, or agricultural training). Once this amount is reached, the farmer receives the tools or service they have purchased from myAgro.

Why does myAgro’s model work?
MyAgro’s model gives rural farmers access to key financial services including cash-flow management and savings, through this approach:

  1. Reliability
    Without the credit and collateral that banks require when opening a savings account, poor people have responded by forming rotating savings and credit funds (ROSCAs) within their communities. This has been replicated worldwide, helping families manage scarcities. However, this informal tool does not provide the accountability, reliability and privacy that banks would offer. MyAgro builds on the success of ROSCAs, where people save through small incremental amounts over the long-term, but with the security and reliability of a formal mobile platform.
  2. Convenience
    MyAgro clients don’t have to travel long distances to access banks, which is especially useful for rural farmers living in remote areas where bank branches do not exist. MyAgro also increases inclusion by making the system easy to use, especially for those who are illiterate. Getting the basic use out of myAgro only requires the farmer to SMS the numbers located on the card they purchased. In addition, no physical cash is involved. In mobile cash transfer platforms such as the successful M-PESA program, some local vendors run out of cash when a customer wants to conduct a transaction, myAgro only relies on digital transactions – a successful approach within cash-strapped countries.
  3. Flexibility
    By allowing farmers to choose how much to save on a given day, myAgro takes into account the variety of shocks that vulnerable populations experience, such as illness in the family or natural disasters. The mobile platform allows them to use their small-scale savings for large-scale purchases.

In just three years, myAgro has managed to address a debilitating financial problem in farming communities in the developing world by providing a reliable and accessible savings tool and allowing farmers to managing their cash flows on their own terms. I look forward to seeing how myAgro expands its current 6,000 farmer membership while also collaborating with other mobile technology platforms to continue providing information and financial services to the benefit of the poor.

Interested in learning more about other ways mobile phones are empowering people in the developing world? Join us in our upcoming course, Mobile for International Development that begins on May 11.

About author 

Ana Tamargo

Ana Tamargo is a development professional and recent graduate from the Elliott School of International Affairs, George Washington University. She recently received a master’s degree in International Development Studies. During this time, Ana completed TechChange’s “Mobile Phones for International Development” course in order to advance her knowledge in using innovative information and communication technologies to facilitate programming and data collection within the local context. She has worked at international NGOs such as Pact, World Cocoa Foundation, and the Rainforest Alliance and has expertise in program advancement, evaluation and research in the fields of sustainable natural resource management, rural poverty alleviation, and bottom-up development. Ana is eager to continue findings ways to incorporate mobile phone technology in helpingempower and provide services to vulnerable populations.

Simply including technology in your M&E plan does not lead to better M&E. This was the mantra as I started TechChange’s Tech for M&E online course in January. I heard about this online course from a colleague, and since Commonwealth of Learning is constructing a new six year strategic plan with a crucial M&E component, enrolling in the course was a no brainer. I enrolled and entered a community of more than 180 international development professionals from over 50 countries. All of us in the course agreed that technology is not the main focus for M&E but rather an important enabler to collecting, analyzing and presenting data.

At the end of the course, I reflected on things you must do to successfully integrate technology in M&E:

1. Establish trust between different stakeholders 

When it comes to using technology for data collection, data security and data privacy are very important concerns. As stakeholders are requiring stronger evidence of impact and the use of data to make informed decisions, building a partnership based on trust among all stakeholders is one way to ensure regular flow of data. This includes having all confidentiality and transparency issues addressed with the stakeholders. All stakeholders need to have confidence in each other and in the process and know that their data will be protected, so there must be enough time and resources for engagement with the stakeholders.

2. Spend adequate time in preparation

Another key element is the level of preparation that is required for any technology use for M&E. The use of checklists, ICT in the different steps of a program/project cycle (diagnosis, planning, implement/monitor, evaluate, report/share lessons) and using an M&E expert are all important. All ethical and cultural issues need to be raised with the stakeholders and to the extent possible, addressed upfront.

It is important to ask these questions as you prepare your M&E plan:

  • How does M&E fit into the organization’s strategy and contribute to achieving the goal?
  • What training and support are required so the field workers are trained, assessing if they have good relationships with the community and what technology will enable best data collection?
  • What role will the field workers play to increase responses to qualitative and quantitative data collection?
  • How does one build confidence with all partners so that the quality of data collected enables better analysis and results?

The course checklist of having a quality M&E plan, a valid design to achieve the results and determining the appropriate technology is very helpful. It also emphasizes the importance of testing this with the stakeholders and identifies how to collect data at the different levels of the project and ensure there is a strong motivation to participate.

3. Consider a mixed method approach to data collection

The key focus of my work is in education, both formal and non-formal. So far, using quantitative data has been the norm for any analysis of education provision and its value to society. But mixed method data collection (quantitative and qualitative) is being increasingly used in education, especially to inform the teaching and learning processes. It allows for an understanding of classroom practices, the learner’s context and its impact on education, offering a more holistic view of whether a project has improved learner performance and learning.

Using ICT for mixed methods of data collection has made the processes easier and ensured easier data storage, tagging, and analysis. Mobile phones can be used to record, transmit and tag the data, and data storage platforms can provide easier access to data, aggregate the responses, and analyze.

The course points to four key questions when designing a mixed method evaluation:

  • At what stages/s does one use the mixed method?
  • Are qualitative and quantitative methods used sequentially or concurrently?
  • Will each method have equal weighting or will one method be more dominant?
  • Will the design be at a single or multi-level?

Just plugging technology in your M&E plan doesn’t do much, but there are steps you can take to integrate technology into M&E so that you can collect and analyze data better. These were the takeaways from the course for me, but the course offered many useful insights into the use of technology for M&E like valuable checklists, platforms that can be used, issues to address for the successful use of technology and a focus on mobile phones. I would recommend the course to anyone looking to learn more about the use of technology in monitoring and evaluation.

Author bio

vnaidoo-Oct2012

Vis Naidoo is the Vice-President at Commonwealth of Learning in Vancouver, Canada. He has spent much of the past 20 years involved in the development of open and distance learning systems, educational technology policy and the applications of technology to education – both in South Africa and internationally.

How can mapping the geolocations of tweets tell a story about global atrocities? How can digital mapping be integrated as a learning tool for university classes?

As part of his final project for TechChange’s online course, TC141: Mapping for International Development in Spring of 2014, GIS professor Tom Mueller wanted his students to explore these topics. In Professor Mueller’s course, “Introduction to Geography” at the California University of Pennsylvania in Pittsburgh, he had his students look for patterns in social media during humanitarian crises such as Ebola outbreaks and conflict casualties, and visually display the spatiality of those events.

Throughout the semester, Tom held several discussions with his students on various topics using social media to map out crises. In his course’s final assignment, Tom had about 100 students in the geography class work in groups to map various Sudan/South Sudan incidents by following several Twitter handles and categorized tweets. After examining their papers, he decided to ask them to choose a country and possibly use CrisisNet as several students became more concerned about gathering tweets rather than the information itself. He felt students would take more ownership of their projects if they independently selected their country, region or topic of choice. So, he is having them search topics on CrisisNet to understand the information that can be part of a tweet. Subsequently, they will examine some news sources and choose a country, topics, etc.

We sat down with Tom Mueller to learn more about incorporating digital mapping into his university class.

1. What is your background in mapping? What interested you in taking TechChange’s Mapping for International Development class?

I have been a GIS professor at a small school just southeast of Pittsburgh called California University of Pennsylvania. I read about crisis mapping and wanted to learn more. When I read about TechChange’s Mapping for International Development online course, it seemed like a great way to acquire more knowledge.

2. What were the most useful tools that you became familiar with in Mapping for International Development online course? How are you applying what you’ve learned in the class?

The two most important tools I found to be useful were MapBox and CrisisNet. While I encouraged my students to use ArcGIS Online in my course, learning about MapBox and its use cases helped me see the connection. It made me realize that this type of project could work with an introductory class with no GIS experience since all we needed was
latitude and longitude of the location. This may sound silly, but after going through it on MapBox, I thought I can do this in ArcGIS Online.

Now I know I should have realized it before but going through the process let me step back and understand the power this project might have on the students.
Hopefully, they understand the power of location, social media, etc.

The most important aspect of the Mapping for International Development course was the feedback from the global class participants and TechChange instructors. It was their discussions that helped me design the project guidelines to let students follow certain Twitter accounts to gather information and attempt to investigate locations based on those tweets.
All the topics we discussed in the TechChange online course helped me to understand the beginnings of this type of geographical analysis and build my ideas. As I started formulating my ideas, I could put this information on the discussion board and the TechChange course participants would give me their comments, and suggestions or ask questions. All this information allowed me to build my university class project from the ground up for my own students.

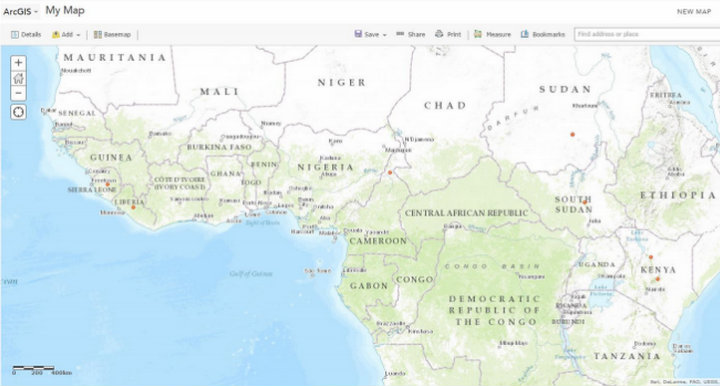
An ArcGIS map produced by one of Tom Mueller’s students indicating the locations of early Ebola incidents.

An ArcGIS map produced by one of Tom Mueller’s students indicating the locations of early Ebola incidents.

3. What inspired you to create this digital mapping exercise for your university students?

In my “Introduction to Geography” class at California University of Pennsylvania in Pittsburgh, my students and I examine geography through a global and regional lens. Sometimes geography might not be the most attractive topic for students, so I needed a hook to pique their interest. Humanitarian issues and genocide seemed to catch the students attention the most. I also knew that the situation in Sudan / South Sudan was active and the students would be able to get a lot more current information from Twitter than other sources.

4. How did your students respond to the digital mapping exercise? What were the results?

My students really enjoyed the assignment as it allowed them to learn about an unfamiliar part (at least to them) of the world. A few students said they could not believe the issues in this area since it did not seem that the popular media was covering the events. If I include a digital mapping exercise again in future classes I teach, my only change would be to may let them choose a developing country and use CrisisNet as their data source. Then they would present their findings to the rest of the class.

5. What is your advice for other professors looking to incorporate digital mapping/blended learning (offline +online) into the courses they offer at universities?

Professors need to be flexible when experimenting with new technology tools in the classroom. For this project, we changed our plans slightly about three times based on conversations with the students and events around the world. The key for my class was not to write a “thesis”; it was for students to understand the power of social media during crises and the spatiality of those events.

About Thomas Mueller

Tom-Mueller

Dr. Thomas R. Mueller is a professor at the Department of Earth Sciences at the California University of Pennsylvania and an alumnus of TechChange’s Mapping for International Development online course. His research agenda has grown dramatically throughout his career at California University of Pennsylvania. He applies spatial theory to the real world, particularly using Geographic Information Systems. His key to building a successful research agenda is to produce work through a variety of scholarly endeavors, including conference presentations, grants, technical reports, book reviews and publications in professional journals. He also has taught numerous GIS workshops for members of the local community, professors at Cal U and other campuses, and for the K-12 community.

Interested in learning different digital mapping tools for the context of humanitarian crises around the world? Enroll now in our upcoming Mapping for International Development online course.

PreMAND field workers testing data collection tablets in Navrongo, Ghana (Photo: N. Smith)

Mira Gupta, one of the star alumna of our courses on Mapping for International Development and Technology for Monitoring & Evaluation (M&E), is a Senior Research Specialist at the University of Michigan Medical School (UMMS). Last October, USAID awarded UMMS $1.44 million to assess maternal and neonatal mortality in northern Ghana. This 36-month project, “Preventing Maternal and Neonatal Mortality in Rural Northern Ghana” (also referred to as PreMAND: Preventing Maternal and Neonatal Deaths) will help USAID, the Ghana Health Service, and the Ghana Ministry of Health design interventions to prevent maternal and neonatal mortality by investigating the social, cultural and behavioral determinants of such deaths across four districts in northern Ghana. For this project, UMMS will be partnering with the Navrongo Health Research Centre and Development Seed.
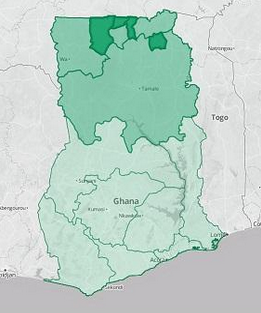
Project Regions and Districts

Project Regions and Districts

We sat down with Mira to learn more about this project and how her TechChange trainings in digital mapping and technology for M&E gave her the skills and background she needed to develop her team’s project in Ghana.

1. What interested you in taking the Mapping for International Development and the Tech for M&E online courses?
I was in the process of trying to learn everything I could about our GIS options when I heard about TechChange’s Mapping for International Development course. It provided a fantastic introduction to the range of approaches being used on international development projects and the variety of organizations working in that space. The course material helped me identify which types of visualizations would be most appropriate for my team’s research. I especially benefited from the many sectors represented in the TechChange sessions because while I was trying to create a project for the Health sector, I actually learn best through a Democracy and Governance framework given my previous background in this field. TechChange provided access to mapping specialists in both areas through its instructors and other class participants.

Just as I heard of the mapping course right as I needed it, the same thing happened again with the Technology for M&E course, which I took a year later. By that point, the PreMAND project had just been awarded and I learned that I would be responsible for the evaluation components. I was excited to take the TechChange course because I knew it would provide a great overview of the many different tools being used, and that I would benefit immensely from the participation of classmates working on projects in similar settings. As expected, the content presented was incredibly valuable in informing our project approach in terms of our field data collection, methods of analysis, and presentation of findings.

2. How did the mapping component of this USAID-funded project come together?

The Three Project Phases: Research will inform the visualisations, which will inform programming

The Three Project Phases: Research will inform the Visualisations, which will inform Programming

While working on a maternal and neonatal health qualitative study a couple of years ago, I sensed that there were themes and patterns in the data that were difficult to verify since the locations of the respondents had not been geocoded. Some of the variables indicated 50/50 probabilities of any particular outcome, which seemed to suggest that there was no pattern whatsoever when viewed as a large dataset. Because my background is in Democracy and Governance, I used election maps to illustrate to my research team that once geocoded there might in fact be very distinct geographical trends in the data, drawing parallels to the locational breakdown of political party support in the United States.

I was in the process of researching mapping resources when I first heard about the TechChange’s Mapping for International Development course, and through the course I met some of the mapping experts that ultimately served as key resources in the development of our project strategy. The course gave me the necessary base knowledge to effectively liaise between our health researchers and the mapping experts to determine the best approach to meet our data visualization needs. We were extremely fortunate to have USAID-Ghana release a call for outside-the-box submissions under its Innovate for Health mechanism, right as we were developing our program concept.

3. What are the biggest challenges you anticipate in undertaking this project?
For the visualization component, generating the base layer maps will be more difficult than we originally anticipated. The various pieces of data we need are spread throughout different government sources such as the Ghana Statistical Service, the Lands Commission, and the Ministry of Roads and Highways. We will need to consult with each of these groups (and likely many others), to explore whether or not they will allow their data to be used by our project. It will require some agility on our part, as we need to stay flexible enough so that we collect any outstanding geographic data we may need through our team of field workers. While there are many moving pieces at the moment, it’s exciting for us to think that we’re building what may be the most comprehensive geographic base layer map of the region, as an initial step in developing our health indicator analysis tool.

There are also a handful of challenges related to evaluation. The primary purpose of our project is to provide new information to clarify the roles of social and cultural factors in determining maternal and neonatal deaths, and shed light on a valuable set of drivers which up until now have been unclear. We are currently in the process of finalizing our M&E framework, which has been a complex process because our project doesn’t fit the mold that most performance indicators are designed for. As a result we’ve been carefully drafting our own custom indicators through which we’ll measure our project’s progress and impact.

One of our most interesting evaluation challenges has been the development of our Environmental Mitigation and Monitoring Plan, which is traditionally intended as a tool for implementing partners to take stock of the impacts their work could have on the natural environment. In our case, we’re using it as a tool to think through our ethical approach to the potential impact of our project on the social and cultural landscape, given the challenges associated with collecting very sensitive health information and the need for data privacy. It’s pushing our team to think through every step of our project from the perspective of our various stakeholders, and has yielded many valuable insights that have strengthened our program approach.

4. What are the tools that you became familiar with in Mapping for International Development and M&E and plan on using in this project and how will you apply them to your project?
I came into Mapping for International Development knowing very little about the resources available in that space. Several of the tools that I became familiar with through the class, such as OpenStreetMap, MapBox and QGIS were highly applicable to our project in Ghana. After participating in the session led by Democracy International and Development Seed, I reached out to those instructors for their input on how I could best translate my project concept into actionable steps.

The visualizations I hoped to create were complex enough that I soon realized it would make the most sense for our research team to work directly with a mapping firm. We were so impressed by the technical feedback and past projects of Development Seed that we established a formal partnership with them and worked together to refine the vision for the project that was ultimately funded. TechChange’s training gave me the knowledge I needed to select the right partner and understand how best to combine our research goals with the available mapping resources to maximize our project’s impact.
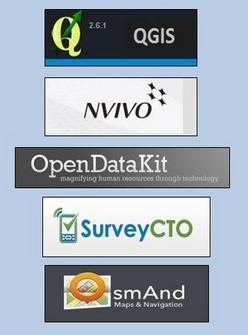
Programs used on the PreMAND project

Programs used on the PreMAND project

In Technology for M&E I learned about the capabilities of different devices, survey apps—those able to capture geodata were of particular interest to me—and even project management tools. There were many helpful conversations both in the class sessions as well as in the participant-led threads around the data collection process, data privacy, and the ways in which project findings can be best communicated to a variety of stakeholder groups. What I found to be most relevant and applicable to our Ghana project were the conversations surrounding human-centered design, and the use of rich qualitative data. I gained a lot from the session led by Marc Maxson of GlobalGiving, who discussed which forms of data are the richest and easiest to interpret. The University of Michigan and our partner the Navrongo Health Research Centre already excel in qualitative data collection techniques, but the conversations throughout the TechChange M&E course inspired some new ideas as to how we might incorporate multimedia such as video and photographs in our qualitative data collection process to make our project deliverables that much more substantive.

5. What is your advice for researchers working to integrate more data visualization and mapping in their research and project interventions?
My advice would be to focus on the end user of your data and identify their needs and interests early in the process. That clarity can then be used to inform 1) what content will be most useful, and 2) what presentation format(s) will be most effective. It’s important to do some form of a needs assessment and let stakeholder feedback guide the project’s design.

In the case of our Ghana project, we are implementing a two-prong approach to our visualizations because both the government representatives and our donor will find an interactive web application most useful, while local community members in the rural North will benefit more from group discussions centered around printed maps.
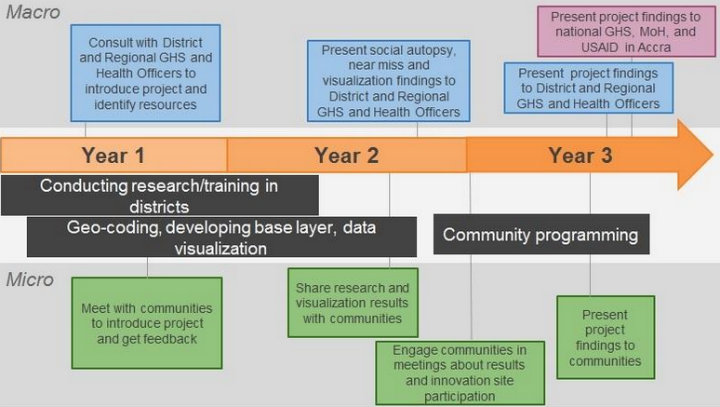
Feedback loop with two stakeholder groups: the government of Ghana and local communities

Feedback loop with two stakeholder groups: the government of Ghana and local communities

It is common to sometimes present health indicator data solely as points on a map, but we are designing our visualizations to be much more detailed with background layers including health facilities, schools, compounds and roads so that those viewing the health indicator data can orient themselves a bit better to the local context. Had our end-users only been the leaders of those individual communities such detailed maps may not have been necessary. Similarly, the visualizations for one stakeholder group might incorporate a lot of words or even narrative stories based on their level of education, while for other stakeholders, those visualizations will be more image-based and we’ll orient them to the maps through presentations in their local communities.

About Mira Gupta

Mira Gupta

Mira Gupta is a Senior Research Specialist at the University of Michigan Medical School (UMMS), where she focuses on program design, strategy and evaluation. She has developed successful international aid projects in 18 countries, including 13 in Africa. Mira began her career in the Democracy and Governance sector where she worked for organizations such as IFES, the National Democratic Institute, and the Carter Center. She also developed projects in the Economic Risk and Conflict Mitigation sectors before transitioning into Global Health. Her research on the effects of local power dynamics on health-seeking behavior in northern Ghana is published the current edition of Global Public Health.
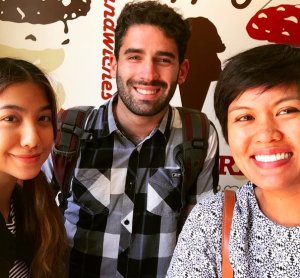
GIZ Nepal participants Pushpa Pandey, Valerie Alvarez, and top TechChange student Bikesh Bajracharya with TechChange Communications Associate Samita Thapa, (and TechChange cubebots).

In our most recent mHealth online course, twelve participants from GIZ (Deutsche Gesellschaft für Internationale Zusammenarbeit) Nepal enrolled in the course to support its mHealth pilot for adolescent sexual and reproductive health. This holiday season, I was fortunate enough to return to my native home of Nepal to meet these TechChange alumni in person at the Nepali-German Health Sector Support Programme (HSSP) at their new office in Sanepa, Nepal. Since the September 2014 mHealth pilot launch, more than 150,000 adolescents have used their interactive service.

Nepal’s National Health Education, Information and Communication Center (NHEICC) developed a National Adolescent Sexual and Reproductive Health Communication Strategy (2011 – 2015) that stressed strongly the use of modern methods of communication in its implementation. GIZ, Health for Life (H4L), and the UN Population Fund partnered under NHEICC’s leadership to initiate this SMS based mHealth project – the first in Nepal. The SMS messages and interactive package focus on delaying marriage and pregnancy, healthy timing and spacing of babies, health and hygiene, and addressing gender based violence. The local mobile services provider, Nepal Telecom and NCELL, distributed the interactive SMS package that includes an encyclopedia, role model stories, quizzes, and a hotline for further questions.

Mr Khaga Raj Adhikari, Minister, Ministry of Health and Population launching ‘m4ASRH’ (Mobile for Adolescent Sexual & Reproductive Health) on 18 September 2014.

Mr Khaga Raj Adhikari, Minister, Ministry of Health and Population launching ‘m4ASRH’ (Mobile for Adolescent Sexual & Reproductive Health) on 18 September 2014.

Since Pushpa had shared the status of the GIZ mHealth pilot in Nepal as her final project for the mHealth online course the day before we met, it was especially great to catch up with her in person! She expressed that this mHealth course was much more engaging and fun to complete than other online courses she has tried out. Bikesh, the top user in our course with over 400 tech points, is new to the GIZ team and very excited to apply what he has learned in the mHealth course to his work in Nepal. Valerie recently arrived in Nepal and very new to the GIZ-team, was also excited to learn how much the other participants were engaging and that she can still access all course material for four more months.

All three GIZ Nepal participants shared their astonishment on how many tech points Bikesh was able to stack up in the course and also the fantastic course facilitation by Kendra. They also admitted that hearing Pushpa present in the mHealth course gave them insights that they weren’t aware of even though they work at the same office. While taking a technological approach to development projects in a country like Nepal can be challenging, it is an even bigger challenge to get the government’s buy in. It was exciting to learn that despite some hurdles, this mHealth pilot was an initiative supported by the government of Nepal.

We are excited for the future of mHealth in Nepal and wish GIZ all the best in their continued success! We are also excited to welcome six more participants from GIZ Nepal in our upcoming Technology for Monitoring and Evaluation course in January to better measure the impact of this mHealth pilot! It is wonderful to see how GIZ is committed to mHealth and M&E through their investment in technology capacity building in Nepal.

When setting new year’s resolutions, we often set goals that include getting healthier, improving our relationships, and advancing our careers. We are fortunate to live in an era where the Internet contains an enormous amount of educational content including online courses that can keep our skills sharp and expertise relevant in a competitive global job market. However, it can be tough to keep up with the all the webinars, articles, blog posts, industry publications, and online courses with life’s competing demands.

Here are some tips on sticking with your professional development goals through online learning from several members of the TechChange alumni community.

1. Define your end goal
Be clear on what you want to get out of the online class. Catherine Shen likes to approach online learning by looking at two specific types of benefits: 1) concrete skills or knowledge, and 2) a course certificate to provide evidence of these new skills or knowledge. “By clearly defining what you want from an educational experience, you are more likely to keep motivated throughout the course with your goals you want to achieve in mind. This goal-oriented mindset is especially important to maintain the discipline needed to regularly log into your courses to earn that certificate when you’d rather be eating chili and watching Game of Thrones,” says Catherine.

Perhaps your goal might include getting a new job or switching to a more social mission-driven career. If that is the case, look at an interactive online learning experience as an investment toward achieving these goals by networking with professionals who could connect you to your next opportunity. Maybe your goal might be to get up to speed on any new industry vocabulary/jargon that you need to be aware of for your current or next job.

2. Schedule in your online learning time like you’d schedule a meeting.
Block off a regular time for your outside learning. Routines can be helpful to structure in time set aside, which might be a daily time or a weekly day for a few weeks. With this regimen in place, you’ll mentally prepare yourself and budget the time needed to get the work done.

If your online course has live interactive learning components like several TechChange courses do, make sure to take advantage of these live sessions as much as possible.

According to mHealth alumna, Lauren Bailey, it is very important to “be diligent and set aside time every day to log into the course — even if you can only spend 20 minutes. Try to attend live events and make sure to ask questions that enhance the discussion.”

Serial TechChange serial alumna Carolyn Florey also agrees with Lauren about the importance of live events. “Make attending live events a priority. Look at the live event discussions as part of your continuing education,” says Carolyn. “Rarely will you get an hour of access to these industry experts. “

According to Mobiles for International Development alumna, Ivy McCottry, who now works at AT&T, “The ‘live event’ sessions are very helpful. Even though these sessions are recorded and archived, it’s good to sit in live because you can contribute questions in real time and process the context of what’s being presented. You also don’t have to mull over content independently – you can send questions immediately or expand on an idea that has been mentioned. When attending these events, I always made sure the facilitator knew I was there at the session so my interests would be covered in the presentation.”

3. Focus on what you’re most interested in and what is most relevant for you.
As mentioned earlier, knowing your end goals helps you focus when your time and energy is limited. “The more you know precisely what you want to gain from the course, the more you will get out of it as you can prioritize those topics and ask questions that will focus discussions on areas you care about most,” said Ivy.

According to mHealth alumni, Dr. Layla McCay, “Various exercises [in TechChange courses] are tailored to what I happen to be interested in so I don’t have to complete every single thing. I can just see what’s relevant for me and take a deep dive into that.”


4. Integrate and apply coursework into your current (or dream) job

Especially for professionals who get professional development funding from their employers, it can be very helpful to set expectations with a supervisor before beginning a course to discuss how to apply learnings into current or future projects. Applying your new skills/knowledge to your work could mean starting a new project or sharing your learnings with a team-wide presentation or brown bag lunch sharing session. By making your employer aware of your professional development goals and let them know how you’re going to use this class next in your work to benefit an organization, you can further your career.

Mobiles for International Development alumnus, Trevor Knoblich, recommends leveraging TC105 or other courses within your own organization. “If you’re advocating for your organization to adopt new mobile tools and applications, you will have a variety of useful materials from TC105 to help make your case,” says Trevor.

Many TechChange alumni also use their online courses as a testing ground to experiment with new technologies in their current work projects. For example, Sairah Yusuf at Generation for Peace did so by visualizing the participants of a training program by creating a map of participants across the Middle East using MapBox. A team based in Hanoi and Ho Chi Minh City at FHI 360 Vietnam created mHealth pilots to address HIV based on the knowledge they acquired from taking their mHealth online course as a group.

5. Make connections by participating as much as you can.
Ivy highly recommends networking with guest speakers and course participants. “If speakers represent organizations that you want access to, definitely enroll in the course. The access that TechChange provides at this dollar value is unheard of and a great return on investment,” said Ivy. “Read profiles of other people who were taking the class and alumni as well. I was definitely inspired by the success stories of Carolyn Florey and Trevor Knoblich who advanced in their careers with the help of TechChange courses.”

Carolyn also suggested for online learners to “Read through other participants’ comments and questions. Often, other participants will have experience you don’t, so they’ll have some informed questions and insightful comments.”

According to Trevor, “You’ll ultimately get more out of the course the more engaged you are with your classmates, the professionals who are presenting, and the TechChange staff.”

Lauren agreed. “Be sure to reach out to classmates and find out more about their backgrounds and career paths. It’s great to have connections from all across the globe!” Throughout the duration of the course and even after, there will be opportunities to connect with course participants online and offline, from Washington,DC to Lusaka, Zambia.


Any other tips that have worked for you? Please share your online learning tips in the comments or tweet us @TechChange. Don’t forget to invest in your career by taking a course with us.