When is it ethical to either restrict or share information during violent conflict? Two tweets summarized the information challenges of the South Sudan Watch crisis map will face in the coming days.

 Tweet #1: Is it ethical to restrict information to the public?

Tweet by Dan_E_Solo

As of the time of this writing, the public-facing crisis map for South Sudan Watch is still disappointingly sparse. Daniel Solomon, an expert on genocide and involved in anti-genocide networks (also author of the Securing Rights blog), observed that the crowdmap was simply capturing a handful of “traditional” media reports instead of plotting real-time incidents for the public to see.

It’s possible that the public map doesn’t yet display all the information available because it’s unclear if doing so would cause more harm than good – and that’s not an easy call to make. But is it ethical to restrict information if it could better inform humanitarian intervention or even save lives by providing information directly to those on the ground? Nathaniel Raymond would refer to as the “Right to Information in Disaster,” with information being as valuable as food, water, shelter, and medicine.


Tweet #2: Is it ethical to reveal information about the vulnerable?

Tweet by Anahi

But experienced crisis mappers have already begun to weigh in on how dangerous sharing this information can be — especially without sufficient context. in a post on “The Conundrum of Digital Humanitarianism: When the Crowd Does Harm” Anahi (a co-founder of the Standby Task Force) cautions:

“But the truth is that the beauty of the internet, in humanitarian crisis, is also its curse: everyone can do everything and does not need to be “trained” or to be a “professional”, or to be part of a formal organization.”

Fortunately, there are opportunities for a middle ground. Organizations such as UN-OCHA can become what Patrick Meier terms an “Information DJ,” combining external information with input from local tech-savvy communities. However, Meier too warns that “enthusiasm for new technology doesn’t overtake ethical and humanitarian accountability principles around informed consent, data privacy, and do no harm.”


Conclusion:

It’s unclear at this point which information will be shared or even if the map will stay available to the public (or if a bounded and bifurcated public/private method is better suited to the challenge). But what is clear is that the coming challenges to crowdsourcing information for the conflict in South Sudan are not technical, but organizational and ethical.

Interested in learning more on this topic from conflict management experts around the world? Join our online course on the role of technology in addressing conflicts in South Sudan and other parts of the world including Kenya, Syria, Uganda and Myanmar. Apply now to join this January 13 – February 7 course.

Spreading violence in South Sudan threatens thousands of civilian lives, political stability in the region, and even outbreaks of transmissible disease (NYT). As the fog of the initial outbreak of war begins to clear, the question becomes how the international community should begin to address this hot conflict, and prepare for what is likely to be a global humanitarian response effort. Student networks such as STAND are writing open memorandums to policymakers, while volunteer technical communities such as contributors to The Enough Project and the Satellite Sentinel Project (SSP) are sending their pleas straight to the media. But as we move from advocacy to response, a number of core questions come to mind:

  • Who are the key actors?
  • What are their motivations?
  • What are our windows of opportunity to see a reduction in violence?

And as these questions get answered – how do organizations ensure that their work is complementary?

Coordinating the Information Flow

With information flows from the region taking the form of emails, phone calls, text messages, and videos from people’s mobile phones, connecting the dots is the entire point of organizations such as the Digital Humanitarian Network (DHNet), whose activation TechChange was proud to be part of last year, and reliefweb.int – a well known asset for first responders. But because South Sudan is still in the midst of a hot conflict, actors coordinating with one another must take into consideration the lives of individuals who are still in the region to ensure that no additional harm is done through the sharing of this information.

The good news is that there are guidelines for such a response effort, not least from what has been provided by the lessons from the Libya Crisis Map by OCHA, who are also keeping tabs on the current crisis (see image below). Andrej Verity, an Information Management Officer at UN-OCHA identified three specific ethical issues in Libya:

1. Identify. We did not want any information provided in the LCM that could be used to identify the individual who reported.

2. Location. To avoid anyone from being able to pinpoint anyone reporting, the data was generally anonymized to the centroid of the city it was reported from.

3. Do No Harm. Given the situation in Libya was conflict-based, we needed to ensure that whatever we did minimized the chance of causing anyone harm.

Sudan: Humanitarian Snapshot (30 September 2013) [UN-OCHA]

Connecting Grassroots to Government: South Sudan Watch

Connecting grassroots volunteer networks to government response is not an easy task, as our partners at the Wilson Center have explored these challenges in depth. Moreover, their recent workshop report lists “[f]actors obstructing the adoption of crowdsourcing, social media, and digital volunteerism approaches often include uncertainty about accuracy, fear of liability, inability to translate research into operational decision-making, and policy limitations on gathering and managing data.”

These are not small challenges, but one recent effort deserves recognition: A recent Ushahidi deployment for South Sudan Watch. According to the About page, it is designed to be just such a centralized reporting mechanism for watchers of the current conflict in South Sudan. Also worth noting, is that the entry forms have been modified to aid in conflict analysis, and the public information restricted to protect those on the ground and report contributors.

Will it make a difference? Maybe. Rob Baker of Ushahidi (and until recently a Presidential Innovation Fellow) shared with us:

“It won’t be easy, but we believe it is necessary to try. We can learn from past examples to help on the ground — nobody is here to just make a map, but hopefully to improve the situation on the ground through a better understanding of what is happening through technology and crowdsourcing.”

If you are interested in learning more, please do check out the live Ushahidi deployment and see how you can contribute. We’ll continue to add more information as it becomes available.

South Sudan Watch: http://southsudanwatch.ushahidi.com/

Want to learn more about how digital mapping and other technology like social media and and mobile phones are addressing conflicts around the world? Enroll now in TC109: Technology for Conflict Management and Peacebuilding, which starts January 13, 2014.

Remember when map making used to be simple? Neither do we, which is why we’re teaching a new course on Mapping for International Development. This increasingly complex intersection between open/closed data, online/offline tools, and practitioner communities all relevant to digital mapping could use a handy primer.

Last week, MapBox closed a $10 million Series A from Foundry Group as part of a move seen to rival Google Maps with an open-source mapping solution. While the results of this investment remain to be seen, there are echoes in this conversation from the intense debate last year around the World Bank’s initial decision to use Google Map Maker instead of OpenStreetMap, which raised concerns from organizations such as Global Integrity about why the bank would choose a closed data solution over an open one. Ultimately, the World Bank reversed its decision and went with OpenStreetMap, which provides simple, complete access to its database under an open license.

And it’s not just about the maps themselves, but what is being done with them. The Global Slavery Index by Walk Free chose to visualize slavery numbers by country. Team Rubicon partnered with Palantir to repurpose maps used to track IEDs to help rebuild homes needing repair after Hurricane Sandy. Democracy International and New Rights Group visualized voter data in Tunisia to present stakeholders with better information for the electoral process. And InterAction produced an NGO Aid Map to improve coordination of NGO activities.

Image from the Atlantic on Morningside Analytics visualization

Photo Credit: The Atlantic

But data visualization and mapping isn’t just restricted to geodata. Since information and individuals are only a click away online, work being done by Morningside Analytics to map the “cyber-social geography” of the internet — analyzing who is talking to whom and what they’re talking about — is just as valuable, if not more so.

So far, we’ve had a great response for the course on Mapping for International Development, which is nice to know we’re not alone in our enthusiasm. We’re excited to welcome participants so far from about a dozen countries including Australia, Cameroon, Canada, Ecuador, Jordan, Kosovo, Mexico, the Netherlands, the Philippines, USA, and UK. Participants in this course represent organizations such as the World Bank, UN Foundation, UNICEF Innovations Lab Kosovo, Gallup, InterAction, Telecentre Foundation, Canada Foundation for Innovation, Australian National University, IFES, School of Oriental and African Studies, Centre for Development Innovation, Generations for Peace Institute, ACT/JEVS Human Services, CIMM, Stability: International Journal of Conflict and Development, and many more.

There’s still time to join, so if you’re interested in registering for our four-week online class on Mapping for International Development, register here. We hope you’ll join us!

By Kate Pawelczyk, UNICEF – Cross-posted from Voices Of Youth

Maps can represent many things – adventure, discovery, a journey, a return home or even a sense of order – but now they are also representing youth empowerment.

In 2011 UNICEF staff from New York and Rio de Janeiro, a team of digital innovators, government officials, community leaders and other partners came together on a mission: to train young people to create maps which depicted the social and environmental risks in their surroundings.

Two years, 12 communities and two countries later, this process of training youth to map and participate in the improvement of their neighborhoods is Voices of Youth Maps, a UNICEF initiative which promotes the use of digital mapping to empower young people.

Voices of Youth Maps is now looking for up to 50 tech-savvy individuals from around the world who are ready to help test the newest feature of the digital mapping technology: a system that allows users to draw attention to the most urgent issues they have mapped.

Creating maps, promoting change

There is no better way to see the potential of digital mapping than in Morro dos Prazeres, a neighborhood in the heart of the Santa Teresa area of Rio de Janeiro. In 2011 the first training of young digital mappers took place in Prazeres with UNICEF, the Public Laboratory for Open Technology and Science and the MIT Mobile Experience Lab. Since that first training, 50 youth mappers in Prazeres have collected information on social and environmental risks with a specially designed mobile and web app called UNICEF-GIS.

UNICEF used the maps the young people created to work with the local municipal government to find and fix the most life-threatening issues documented by the young mappers. Spurred by the work of the mappers the community also decided to address the issue of garbage, which was captured on the maps, launching a community-based Reciclação program for recycling and garbage disposal.

Mapping successes bring a new challenge

In 2012, expansion of digital mapping in Rio and in Port-au-Prince, Haiti, revealed a new challenge. With so many reports coming in, those responsible for assessing the digital maps could no longer quickly see which reported issues were most important. A life-threatening landslide risk near a school demanded more urgent attention than a pothole in the road; a way to rank reports by urgency was needed.

To help create a solution, the John S. and James L. Knight Foundation provided UNICEF with a grant from its Prototype Fund to test ideas on how to rank the reports and improve the mapping technology. Working with an organization called Innovative Support to Emergencies, Diseases and Disasters, and with technical advice from MIT, UNICEF developed its Urgency Rank Prototype.

Now the prototype is complete, and Voices of Youth Maps needs your help to test it. During a month-long program the selected testers will learn about how the Urgency Rank works, upload real reports to a map and provide feedback on the system.

If you are between 18 and 25 years old, have access to a computer and the Internet, and have an interest in environmental issues you can apply to test the Urgency Rank Prototype by filling out this form.

Applicants should submit their forms by 30 July 2013.

Note to applicants: The selection process will not be on a first-come, first-served basis. In selecting the participants we will strive to have representation from as many regions of the world as possible, as well as gender balance.

Since the Urgency Rank system is a prototype reports that are submitted will not be acted upon or reported to any authorities.

Last month, 130 doctors, nurses, development workers, techies, government officials, and academics from 35 countries joined us on an exciting four-week journey through the latest developments in mHealth.

Imagine how difficult (and expensive) it would have been to assemble this group into one classroom in person!

Thanks to the amazing team at the mHealth Alliance and an all star-roster of incredible experts, we managed to build upon the great success of our inaugural effort and deliver a powerful second installment of the online certificate course TC309: Mobile Phones for Public Health.

Three observations/trends emerged during the course:

  1. Mobile data collection most discussed! Mobile data collection, management and analysis gained significant attention in the course forums. We were thrilled to be joined by Yaw Onokwa, one of the founders of Open Data Kit and Jeremy of CommCare who provided students with live demos of their respective software packages and shared a number of insights and best practices for developing surveys, acquiring and managing users, scaling data projects and more. The always-engaging Alain Labrique (Johns Hopkins University) joined us for a fantastic session on the continuum of care that touched on his exciting work in Bangladesh and the importance of investing in the evidence base.
  2. The importance of human centered design (HCD): Human-centered design also featured prominently throughout the four weeks. Isaac Holman (co-founder of Medic Mobile) led participants through an exercise in drawing/mapping a health ecosystem based on HCD principles. Design experts Erica Kochi (UNICEF Innovation) and Robert Fabricant (Frog Design) shared a wealth of insights from their experiences in successfully launching and sustaining mHealth projects in a number of countries. For many of these world-class practitioners, this was the first time they had ever presented in an online course like this.
  3. Fewer pilots + design for scale: After the New York Times featured an article last spring entitled The Benefits of Mobile Health on Hold there was certainly a lot of room for debate and critical discussion about “pilotitis”. Patty Mechael noted that one trend she has observed in last year is fewer organizations are starting pilots more are focused on designing for scale from the onset of a project. And finally, Gustav Praekelt shared the amazing work his foundation has undertaken to team up with leading private sector entities in South Africa to achieve scale (1 million+) in fighting HIV and preparing mothers for childbirth.

Three highlights from the course:

  1. Techies + Healthies: We featured a TEDx Talk by Josh Nesbit titled, “Techies + Healthies”, which prompted an insightful discussion about the need to promote more engagement between practitioners from both fields. We also asked participants to reflect on their own orientation on the healthie – techie spectrum.
  2. Zombies, Zombies, Zombies: What would a TechChange course be without a Zombie Apocalypse. This time, participants had to respond to an impending zombie invasion and practice gathering vital health and preparedness data using tools like Magpi, FrontlineSMS, CommCare formhub, OpenDataKit and more.
  3. What a Map! We asked participants to describe the health systems in their own countries and then crowdsourced an interactive Google Map of everyone’s responses. I personally learned a tremendous amount about the challenges and opportunities that exist in other countries through this visualization and am excited to do more of these kinds of activities in future courses.

While there are always improvements to make and things we’ll work to do differently next time, overall, the course was a huge success. But don’t just take my word for it. Of the 30 participants so far who have completed our post-course survey, all 30 said the course fulfilled or surpassed their expectations and 27 out of the 30 said they are likely or very likely to recommend the course to a friend or colleague.

Here’s a selection of what our participants had to say:

  • “The blend of high notch experts with various diverse experiences in the mHealth and social spaces, the expert coordination, moderation and tech support by Nick and colleagues, brought practicality and vividness to the course. Are you a healthie or a techie? It does not matter. If you want to do mHealth right, then come to this course.” – Francis, World Vision International
  • “I felt truly engaged by this course, and was somewhat surprised by that as other online courses I have taken for credit have felt very distanced and flat in terms of educational energy. If you want to know what the leading experts in mhealth are saying about the state of the field, take this course. The best part? Live webinars that felt like inner circle information (how the insiders talk over drinks) coupled with direct access to ask your specific questions through text chat. I can’t wait to take a refresher course next year to see what’s new!” – Kirsten, Rice University
  • “The TechChange online course platform is amazing! They provide you with online learning that is exciting, user-friendly and highly informative. The speakers in the mHealth course are really great and I have learned a lot from the presentations and exercises. For people who are busy and cannot catch up on-time (like me!), you don’t need to worry because TechChange has provided a platform where you can retrieve videos, materials, audio recordings. So, go with TechChange as your top online course provider!” – Mary Rose, ACCESS Health International

The TechChange online platform also underwent all kinds of upgrades thanks to the tireless efforts of our dev team led by Will Chester. See what some of our participants had so to say:

  • “Here is a learning platform that is designed completely for the convenience of the individual – you can participate in as many sessions as you can and still have opportunity to catch up on those you’ve missed even 4 months after completing the course. You can even rate your performance by the tech points earned and look at what others have earned – which is a great way to motivate or encourage participation.” – Apera Iorwa, mHealth Alliance
  • “I thought the platform was great–very dynamic and user-friendly. I’ve taken several other online courses and this was the best platform thus far.” – Kiara Reilly, Booz Allen Hamilton

Stay tuned for details about the fall mHealth course and be sure to check out our lineup of upcoming courses: Social Media for Social Change, Intrapreneurship: Innovating from Within, and Tech for Emergency Management and more.

We’re excited to announce that we’ve teamed up with Mobile Alliance for Maternal Action (MAMA) to support capacity building and learning for their global community of users and implementers.

When I graduated college two weeks ago, I thought I was done taking classes for a while. Yet, instead of hanging out with friends, finishing season 4 of Arrested Development on Netflix, or even going for a run, I spent my first weekend in DC back in a classroom.

Early Saturday morning, I joined Nick Martin, CEO, at George Washington University to assist him in teaching a two-day, graduate level course on using technology for crisis response and governance. This wasn’t your run of the mill course though. Rather than introducing theorists with lofty ideas, abstract from the reality of disasters on the ground, Nick crafted the course as a realistic, hands-on approach.

As a fun beginning to the day, Nick broke the students into small groups to learn how to use Twitter. Tasked with creating accounts that impersonated celebrities, some of the students crafted hilarious Tweets and interactions. Among my favorites:

From there, we examined a series of potential solutions for crisis response. We considered how mobile phones could be used to collect and analyze data, how we could use CrowdMap and OpenStreetMap to visualize data and dynamically respond to changing geographies, and how social media could be leveraged in conflicts to raise money or locate survivors. This overview of the different platforms allowed us to focus on both the benefits of each solution and, more importantly, the limitations.

The second day of the course featured more hands on implementation of technologies and zombies.

Yep. Zombies.

In this simulation, we were preparing for an inevitable invasion of zombies in Washington, DC. New York City had already fallen, so the students had to design and implement plans for both alerting citizens of the apocalypse and ascertaining how prepared they were. By trying to implement tools such as FrontlineSMS, Magpi, Open Data Kit, and FormHub in a disaster scenario, it quickly became apparent that certain tools were preferable for certain scenarios. For instance, while FrontlineSMS would be fantastic for disseminating information, it would be challenging to run a survey on it. Open Data Kit and Magpi work wonderfully if you have an Android phone, but falters on an iPhone. Formhub, while offering both an Android app and a web-based form, can only accept surveys created in a .xls file type—definitely not prohibitive, but it does require an extra layer of expertise.

After we saved the world, or at least DC, from zombies, we explored a few tools in the sector of finance, health, and governance. Among the highlights for me were m-Pesa, a fascinating mobile-based money transfer system started in Kenya; MAMA, the Mobile Alliance for Maternal Action, which sends valuable information to pregnant women concerning caring for their child; and CrowdHall, a rethinking of the town hall meeting for the digital age.

Both the breadth and the depth possible in these two days impressed me. The number of tools we used demonstrated the tremendous advances and potential of technology to address crises as they arise. Despite my belief that I could avoid a classroom for a few years, exploring these potential solutions was the best possible foray back into education.

This past Thursday and Friday (May 8 & 9) I participated in the ICTs and Violence Prevention workshop hosted by the World Bank’s Social Development Office.  We had an excellent collection of experts from across academia, NGOs, and government who discussed the complexities of using technology for violence prevention.  One of the key takeaways from the event was the analytic challenge of identifying where violence was likely to happen and how to encourage rapid response.

The problem of preventing violence centers of two things; predicting where violence will occur and the ability for institutions to respond.  Emmanuel Letouze, Patrick Meier and Patrick Vinck lay this problem out in their chapter on big data in the recent IPI/UDNP/USAID publication on ICTs for violence prevention.  They point out that instead of using big data to aid interventions by large institutions, that big data can be analyzed and packaged so that local actors can use it to respond immediately when they see signs of tension.  I used this model in my talk on crowdsourcing; the goal is for the big organizations to leverage their processing and analytic capacity to produce data that can be used by local actors to respond to tension and threats of violence themselves.

What made the discussion around this challenge so interesting was that the speakers and audience were able to focus not just on the technology, but also on the ways that different cultures understand information and space.  Matthew Pritchard of McGill University gave a fantastic talk about the challenges of mapping land tenure claims in Liberia, since people expressed land ownership in different ways.  He explained that GIS mapping could contain the data on how people understand their relationship to the land – maps layers could have MP3 recordings of oral history, photos of past use, and graphical demonstrations of where borders were.  Finding ways to move beyond external perceptions of local conflict drivers was one of the goals of the discussions, and integrating technology and social science more effectively is increasingly going to be a way to achieve that goal.

This event was also bittersweet for me, since it was my last time officially representing TechChange as their Director of Conflict Management and Peacebuilding.  Starting May 9, I will be joining Mobile Accord as GeoPoll’s Research Coordinator.  After over two years working with Nick Martin and the team at TechChange, I’ve decided it’s time to focus more on data and analytics in the ICT for development space.  While I’m excited for this new challenge, I’ll miss working in the loft where I’ve learned almost everything I know about ICT4D and tech for conflict management.  I wouldn’t be where I am academically or professionally without the insights and support of the colleagues and friends I’ve made at TechChange.  While I’m looking forward to joining the team and GeoPoll, I’ll always be excited to check the blog or cruise by the office to see what amazing new animation or interactive learning platform Will Chester and the TechChange team have conjured up!

This is a guest post by Dhairya Dalal. If you are interested in using crisis mapping and using technology for humanitarian relief, conflict prevention, and election monitoring, consider taking our course Technology for Conflict Management and Peacebuilding.

Overview

Recently, I had the opportunity to run an election monitoring simulation for TechChange’s TC109: Conflict Management and Peacebuilding course. Led by Charles Martin-Shields, TC109 taught over 40 international participants how mapping, social media, and mobile telephones could effectively support the work of conflict prevention and management.  Robert Baker taught participants how the Uchaguzi team leveraged crowd-sourcing and Ushahidi, a web based crisis mapping platform, to monitor the 2013 Kenyan elections.

For the simulation activity, my goal was to create a dynamic hands-on activity. I wanted to demonstrate how crisis mapping technologies are being used to promote free and fair elections, reduce electoral violence, and empower citizens. To provide students a realistic context, we leveraged live social media data from the Kenyan elections. Participants walked through the process of collecting data, verifying it, and critically analyzing it to provide a set of actionable information that could have been used by local Kenyan stakeholders to investigate reports of poll fraud, violence, and voter intimidation.

Below I’ll provide a brief history of election monitoring in the context of Kenyan elections and provide a more detailed look at the simulation activity.

Brief History of Election Monitoring and Uchaguzi

uchaguziIn 1969, the Republic of Kenya became a one-party state whose electoral system was based on districts that aligned with tribal areas. This fragile partitioning often generated internal friction during the electoral cycle. The post-election violence of 2007-2008 was characterized by crimes of murder, rape, forcible transfer of the population and other inhumane acts. During the 30 days of violence more than 1,220 people were killed, 3,500 injured and 350,000 displaced, as well as hundreds of rapes and the destruction of over 100,000 properties. 2

Ushahidi was developed in the wake of the 2008 post-election violence. Ushahidi, is a website that was designed to map reports of violence in Kenya after the post-election fallout. However, Usahidi has since evolved into a platform used for crisis mapping, crowd-sourced data gathering, and many other things. Since then, the name Ushahidi has come to represent the people behind the Ushahidi platform. 2

Uchaguzi was an Ushahidi deployment, formed to monitor the 2013 Kenyan general elections held this past March. The Uchaguzi project aimed to contribute to stability efforts in Kenya, by increasing transparency and accountability through active civic participation in the electoral cycles. The project leveraged existing (traditional) activities around electoral observation, such as those carried out by the Elections Observer Group (ELOG) in Kenya.3

Election Monitoring with CrowdMaps

TC109 Simulation Figure 1: TC109 Simulation map (view official Uchaguzi map here: https://uchaguzi.co.ke/)

For the simulation activity, we used Ushahidi’s CrowdMap web application. CrowdMap is a cloud-based implementation of the Ushahidi platform that allows users to quickly generate a crisis map. Crowdmap has the ability to collect and aggregate data from various sources likes SMS text messages, Twitter, and online report submissions.

To provide the participants a more realistic context, our simulation collected real tweets from the Kenyan elections that had just occured the prior week. Our simulation aggregated tweets from Uchaguzi’s official hashtag, #Uchaguzi, as well several other hashtags like #KenyanElections and #KenyaDecides. In addition students were tasked with creating reports from Uchaguzi’s facebook page and local Kenyan news sites.

The aggregated information was then geo-tagged, classified and processed by the participants. The participants created reports, which described incidents licrowdmapke instances of voter intimidation, suspected poll fraud, and reports of violence. The CrowdMap platform plotted these reports on a map of Kenya based on coordinates the participants provided during the geo-tagging phase.  The resulting map showed aggregation patterns, which would have allowed local actors to see where certain types of incidents were taking place and respond accordingly.

Conclusion: Going beyond the Technology and Cultivating Information Ecosystems

workflow   Figure 2: Uchaguzi Workflow

While technological innovations have made it easier to collect vast amounts of data in real-time during a crisis or an live event, a lot of process and human capital is still required to ensure that the data can processed and acted upon. Prior to the Kenyan elections, the Uchaguzi team established a well-planned information workflow and local relationships to ensure that information was ultimately delivered to the local police, elections monitors, and other stakeholders who could take action on the reports received. This workflow also delineated volunteer workgroups (based on Standby TaskForce’s information processing workflow) which were responsible for different parts of information collection process from Media Monitoring and Translation to Verification and Analysis.

To provide the participants an understanding of the full picture, we had them assume the role of various workgroups. They were challenged to identify how the information would be gathered, verified, classified, and distributed to local stakeholders. Participants followed the official Uchaguzi workflow and learned more about the challenges faced by the various workgroups. For example how would you translate a report submitted in Swahili? How would you determine if a report is true or falsely submitted to instigate provocation? How would you escalate reports of violence or imminent danger like a bomb threat?

Overall, the participants were able to learn about both the technology that enables the crowd-sourcing of election monitoring and the strategic and deliberate structures put in place to ensure an information feedback loop. Participants were able to gain an understanding of the complexity involved in monitoring an election using real data from the Kenyan elections. They were also given an opportunity to recommend creative suggestions and innovations that were sent to the Ushahidi team for future deployments.


About the Author:
Dhairya Dalal is a business systems analyst at Harvard University, where he is also pursuing his master’s degree in Software Engineering. Dhairya serves a curriculum consultant for TechChange and is responsible for teaching hands-on technical workshops centered around crisis mapping and open gov APIs, as well as strategic lessons on social media strategy and digital organizing.

Sources:
1:Background on the Kenyan Electoral Violence
http://www.haguejusticeportal.net/index.php?id=11604 
2: Uchaguzi Deployment
https://wiki.ushahidi.com/display/WIKI/Uchaguzi+-+Kenyan+Elections+2013
3: Uchaguzi Overview
http://reliefweb.int/report/kenya/uchaguzi-kenya-2013-launched

This is a guest post by Matt McNabb, Principal of Caerus Associates. If you are interested in using mapping for digital organizing, consider taking our course Digital Organizing and Open Government. 


Today, my colleagues at Caerus Associates and I are able to announce the BETA launch of a new tool that helps businesses, NGOs, and governments collect, visualize, and share geospatial data in less developed emerging markets. We call it, CaerusGEO.

Geospatial in the Last Mile

The premise is simple. How can we leverage the cloud to deliver geospatial analysis to non-GIS users most familiar with basic, paper based workflows?

In our experience, most businesses, government institutions, and organizations in frontier markets rarely use technology across the enterprise. In some cases it’s a cost issue, in others it’s social stigma related.  But whatever the reason, ICTs are often used simply to support manual, tabular processes that already exist.

Want to run a survey? Use Word, Excel, and printer.

When it comes to spatial data, this challenge is only magnified. Collecting geospatial information can be hard enough, visualizing and sharing it can be even harder. As a result, geospatial information is often relegated to the expert user.  Of course, the GIS industry as a whole is trending towards accessibility, but rarely is it truly meaningful for most enterprises in less developed markets that simply want to know where things happen.

This is what got me interested in a tool widely used within the humanitarian response community called Walking Papers. The value proposition of Walking Papers has been that it extends geospatial data collection to pen and paper. Print off a map, mark it up, then convert what’s written into geospatial data. No magic. No optical character recognition. Just a simple paper insert that allows people without GIS units to collect spatial information in a way that could be easily geo-rectified.

The problem with Walking Papers is that it offers little back to the data collector. There is no visualization or data management. In fact, it’s really only a lightweight tool that lets the user print off a map and, through some gymnastics, let’s her then use it to edit a basemap on Open Street Map. It offers nothing for the non-technical user simply interested in using paper to collect information about events, or perceptions, or whatever other kinds of information one might be interested in seeing over the basemap.

For the past year, we’ve been wondering what it would take to create a tool that filled this gap. Let normal users capture geospatial data in paper formats and return analytical value once collected.

How It Works

This BETA of CaerusGEO is our first answer to this need. A user is able to create her own survey, find a place in the world where it will be centered, create an atlas and data collection sheets through a standard schema they created, and then manage, visualize, and share the data once uploaded. By bridging cloud analytics to paper workflows, we are able to drive value at enterprise level.

If you’re an NGO and want to integrate mapping into your polling, you can create a survey, manage the data, and facilitate sharing from start to finish. If you’re a business looking to understand your market, you can integrate it into your customer registration process and benefit from basic market intelligence. Although basic in form, the value is derived from a more reality-based understanding of workflows in these markets. Paper matters.

Smarter Public Safety

The very first place we thought to experiment was in the domain of public safety. What could be more obvious than the need for taking those antiquated paper and pushpin constructions used for crude crime mapping and making it more dynamic, analytical, and transparent?

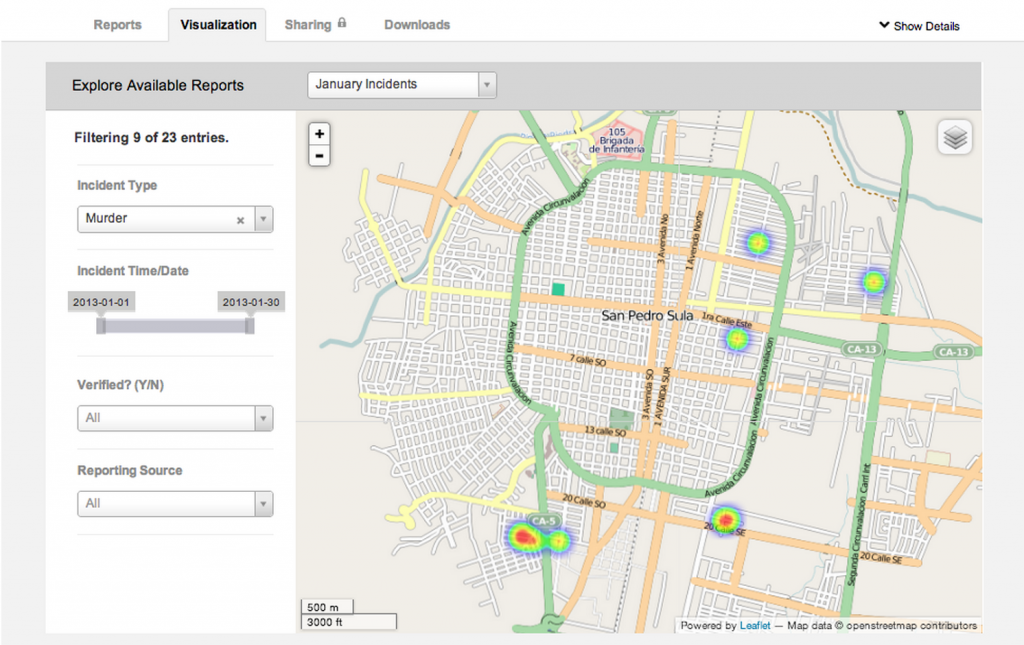
As the Deputy Minister of Justice in Monrovia told me, ‘we send the police where the people are, not where the crimes are… this could help us see how to use our resources in a smart way.’ We can address this challenge by finding minimally intrusive places to insert paper maps into the pre-existing workflows of policing institutions and fusing them together for digital analytics by a single node with connectivity to the cloud.

In parallel, NGOs and violence observatories have the capacity to collect and share their own data, creating a basic framework opportunity for enhancing social accountability within the security sector domain. Perhaps most interestingly, by integrating paper-based mapping that connects to real geospatial data, the longstanding art of Participatory GIS in conflict management and of Crime Prevention Through Environmental Design can be used in so many more ways.

Driving Value For The Private Sector

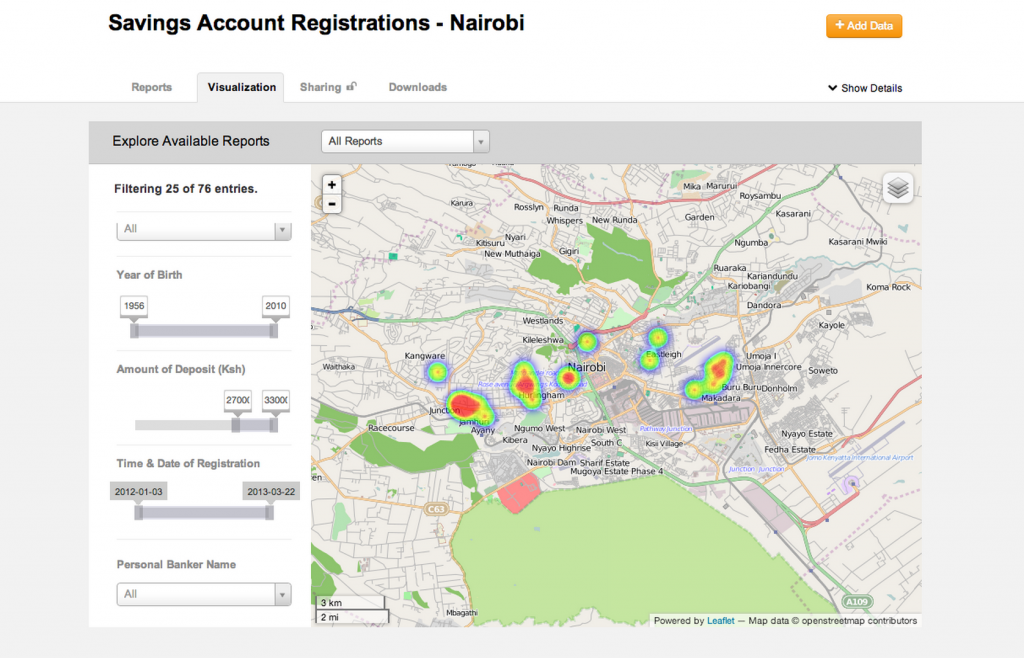
Public safety institutions are not the only ones we have learned can find value here. It’s also a pull for private sector development, particularly in the bottom of the pyramid. Microfinance institutions and others engaged in understanding their customer base face similar challenges.

By extending geospatial data capabilities to private sector development institutions and retail organizations, we have the prospect of significantly improving the precision and reach of private sector particularly to underserved areas.

So Much To Learn

Bending ICTs to the real-world challenges and workflows found in the last mile holds tremendous value to public and private sector institutions alike. For us, this experiment with geospatial information is only the beginning. We hope you’ll join us and give us feedback as our experiment moves on.

Matt McNabb is a member of the Board of Advisors for TechChange, and a Principal with Caerus Associates. For more, you can follow Matt and CaerusGEO on Twitter:  @mattrmcnabb  @caerusgeo


Interested in our upcoming course: Technology for Conflict Management and Peacebuilding? Our next class starts Monday, February 18th. Apply today!

This week, Ushahidi announced the launch of the Uchaguzi partnership in preparation for the upcoming March 4th Kenya elections with the aim “to help Kenya have a free, fair, peaceful, and credible general election.” This announcement came after the Standby Task Force (SBTF) sent an email on February 8th informing their community of voluntary crowdmappers that the SBTF has withdrawn from Ushahidi’s map for not meeting their criteria for activation, but still encouraged their community to participate as individuals. The announcement surprised some in the Standby Task Force community, which had been preparing for deployment, but was not entirely unexpected after the SBTF’s decision to focus on deploying to “natural” disasters after their experience in Syria. The official email explained that:

“The things that we use to ensure that the security, ethics and neutrality that the SBTF stands for is protected, that there is a feedback loop (a physical, on-the-ground response to the data processed by Mapsters) and that we do no harm, e.g. we don’t damage existing in-country responses.”

The notion that external support could be counter-productive is an issue worth considering for the voluntary technical community of peacebuilders. The rise of both local crowdmapping and the global volunteer and technical communities have grown together over the past five years after the violence stemming from the last Kenyan elections gave rise to the Ushahidi platform and the Haiti earthquake saw the development of a global volunteer networks to apply them. Since that time, it’s become clear that the ethical questions surrounding application of technology to peacebuilding are as complex as ensuring technical capability, if not more so.

The challenge of protecting the privacy and security of citizen users is constantly grappled with by the organizations responsible for these tools. The upcoming Kenyan election offers a unique case to take stock of where we stand and where we are moving. Which is why it will form the basis for an activation simulation in TC109: Technology for Conflict Management and Peacebuilding. As part of the activity, we’ll be talking with Justine MacKinnon of the Standby Task Force and Rob Baker of Ushahidi. To understand more thoroughly the opportunities for new technologies to empower peacebuilders.

Of course the ethical impact of new technology is not limited to crowdsourcing, which is why we’re also going to discuss the full spectrum of issues in TC109, from using drones to protect human rights with Mark Hanis to using MapBox to display drone strikes on Pakistan in real-time. New technology often presents as many problems as it solves, and application of even the most potentially beneficial new tools without sufficient forethought can always cause more harm than good.

Class starts on Monday. We hope to see you there! Please feel free to tweet @techchange if you have any questions or send us an email: info [at] techchange.org.