In international development, we all love to talk about our successes, but we need to celebrate our failures too. And failures are exactly what we will be celebrating at Fail Fest on Thursday!

As a celebration of failures, the Fail Festival looks at failures as a mark of leadership and innovation, risk-taking and pushing the boundaries of what is possible in scaling ideas from pilots to global programs.

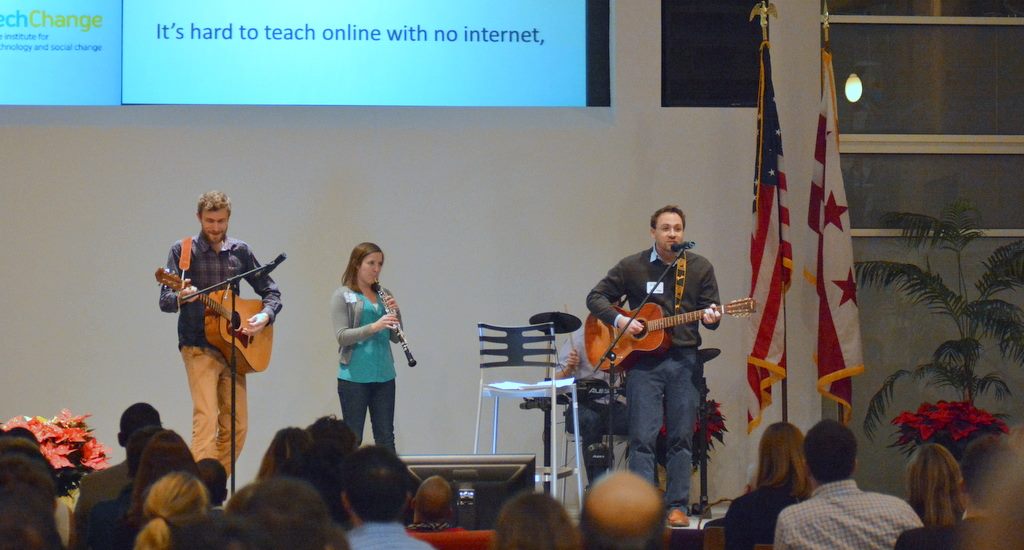
Last year at the Fail Fest, we presented our failures with the TechChange band. We had members across our team perform with vocals, guitar, drums, oboe, and – of course, PowerPoint. We celebrated our failures, from connectivity issues when doing online training sessions on Ebola to unanticipated challenges of moving into a new office.

Fail Fest 2014

TechChange at Fail Fest 2014

We are excited to share our experiences in providing interactive training for social change with all the hurdles that come with it. We had a blast celebrating our failures last year, and we hope to see you at the Fail Fest on Thursday!


Today, most of us can have Pad Thai, a craft cocktail, and a professional masseuse all arrive at our doorstep with a click of a button on our phones, but the same can’t be said about data for our projects. I can’t tell you whether the thousands of schools we paid for last year were actually built and functioning! How about an on-demand service for that data-delivery?

The on-demand economy is delivering increasingly brilliant things for our daily lives – at least in advanced economies. There are so many on-demand food delivery options that investors now see the market is beginning to bottom out with saturation. Last year, over $3.89 billion, purely of venture financing, went to on-demand startups other than Uber.

But it’s yet to penetrate how we do business. First Mile Geo wants to change that.

Insights on Demand
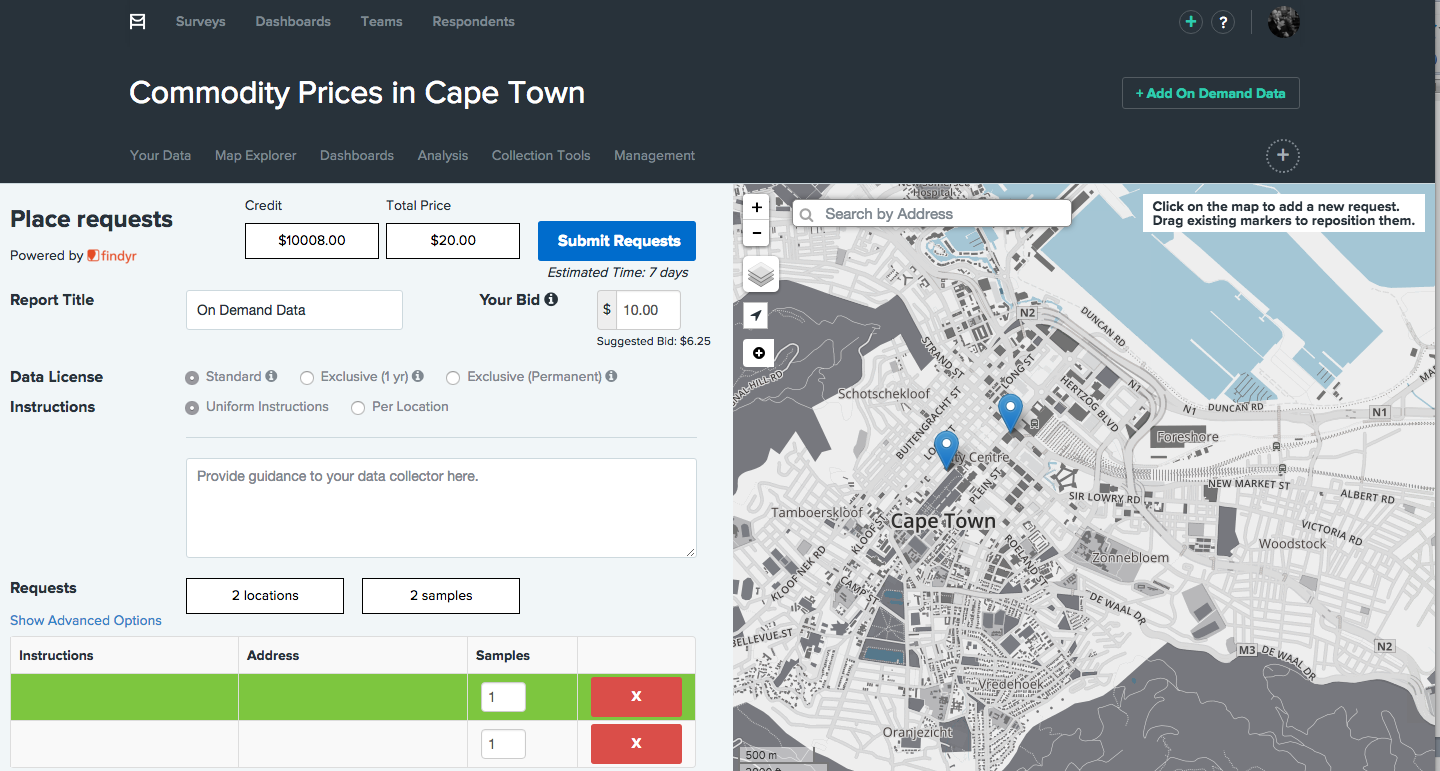
We call it Insights On Demand. Drop a pin anywhere in the world, place a bid, task a local to capture data on your behalf, and generate near real-time dashboards, maps, and comparative analytics. No tech team, no GIS specialists, no field managers tabulating survey results. The entire process delivered, on-demand.

600x600-looping-compressor

How it works
The process is pretty simple. Like all of the other tools you may have seen in First Mile Geo (eg mobile, SMS, websurveys, physical sensors), all you have to do is create a form or survey then select the technology for collection –in this case ‘on demand’.

Drop a pin (or multiple), set a sample size (running a survey?), set a bid on how much you’re willing to pay, and you’ll see results shortly thereafter.

ondemand.task

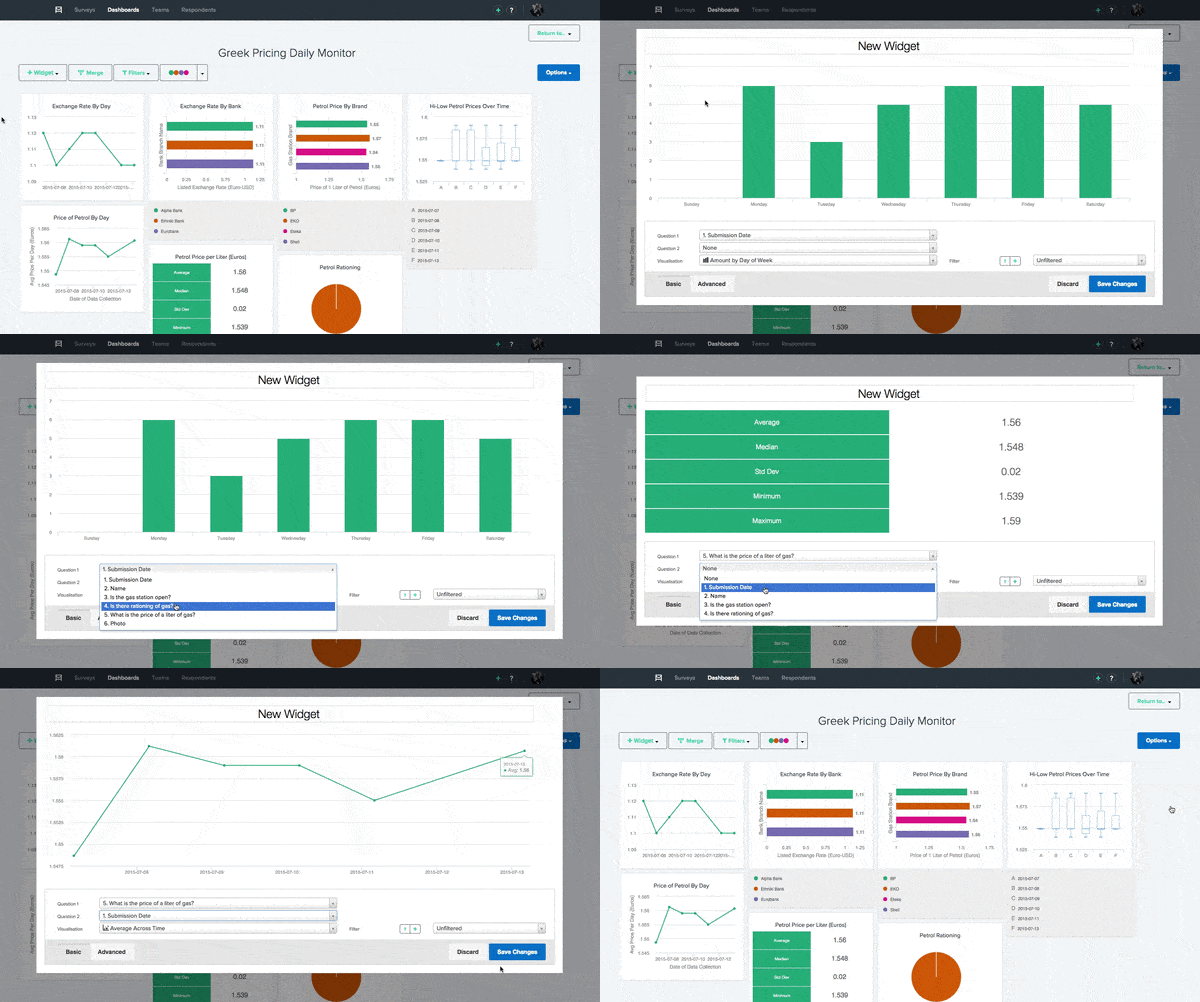
As data arrives you’ll be greeted with real-time maps, dashboards, and powerpoint or pdf executive briefing documents in your preferred language.

dashboard.greekcrisis

A future envisioned
Today, there are over 4 dozen mobile data collection apps. And that’s not even including the other ways we use phones like SMS, IVR, or mass analysis of phone use patterns. But regardless of how we use these tools, data analytics can still be time-consuming: identify the need, allocate resources, create a survey or form, train enumerators, analyze results, write-up findings, brief it, and market the successes.

The future of data analytics in development, where systems are smarter and the institutional burden is lessened, is arriving. We think data delivered on demand, through services like our affiliate partners at Findyr, will have a major role to play in realizing it.

We are excited to have Matt present a demo of First Mile Geo’s Insight on Demand in our data collection course tomorrow! Interested in learning how to implement technology for your M&E needs? Check out our courses related to Technology for Monitoring and Evaluation

About Matt

Matt McNabb
Matt McNabb is CEO of First Mile Geo and a member of the TechChange Board of Advisors. He also serves as an Adjunct Fellow at the American Security Project and a member of the Board at Epirroi, a Beirut-based management consulting firm.

By Kevin Flanagan and Yuting Liao

A few weeks ago, my colleague Yuting Liao and I had the opportunity to attend MERL Tech—an industry conference of sorts designed to bring together M&E practitioners, researchers, technologists, and development professionals—on behalf of the Monitoring, Evaluation, and Learning (MEL) team at the National Democratic Institute (NDI).

At NDI, the MEL team is always on the lookout for innovative M&E practice that can be effectively applied to the democracy and governance sector and this event seemed like an excellent opportunity to explore the “big ideas” and partake in a larger discussion: what can information and communication technologies (ICT) offer to monitoring, evaluation, and learning work as the pressure to integrate ICTs into many aspects of development programming continues to rise.

Offering nearly thirty presentations, the event provided us ample opportunity to sit back and revel in the opinions of the experts, as well as contribute meaningfully to roundtable discussions and collaborative brainstorming activities. As such, these are the five takeaways:

1. More data does not necessarily mean more learning

ICT can make data collection easier, however, it’s crucial to ask the question: is this the data we need? “Big data” is enticing and a common mistake of the novice researcher is: let’s collect as much data as we can. But will that data answer your evaluation questions or will it simply be distracting? While collecting larger volumes of data could certainly result in unexpected observations, if data collection is not strategically tied to your evaluation questions, it does not necessarily lead to better learning. Quality is more important than quantity.

2. ICT can increase the level of risk for the subjects of the evaluation

Data hacks happen, so start by being scared. Whether we want to admit it or not, ICT implementations introduce additional risks to M&E work, particularly when it comes to privacy and data security. And yet, too often M&E practitioners don’t address the risks until after a breach happens. Worry about this in advance and create a threat model to assess assets, risks, and vulnerabilities.

3. Be a data-led organization, not just data-driven

While ICT does help improve data accuracy, organizations that embrace a “data-led” mentality will empower their users to strive to better understand data and incorporate it into their decisionmaking processes. Successful learning initiatives rely on better interpretation and analysis of data, and ICT for evaluation is useless without capable analytical and sector experts.

4. ICT can expand your sample size, but be mindful of the unexpected challenges in sample bias

When collecting data, ICTs can expand the reach of your evaluation efforts, creating opportunities to capture data beyond the traditional “beneficiaries” of a program. However, the “digital divide” may perpetuate the issue of sample bias, and your results may be valid only for those segments of the population with digital access.

5. There’s no ICT “quick-fix” to improve monitoring & evaluation

While it’s possible to achieve a high level of methodological rigor through carefully designed ICT studies, it’s not always easy to do so—often being technically complex, expensive, and time-consuming. Most importantly, effective ICT is built on sound monitoring & evaluation strategies, and incorporating ICTs into M&E requires long-term institutional commitment and evaluation capacity development.

Despite the wide breadth of content, there was a common theme: “It’s ok to reinvent the wheel, not the flat tire.” These words spoken by Susan Davis during a five-minute “lightning” presentation, struck an unexpected chord with the audience, attendees and presenters alike. Whether these are words of comfort for the tech-timid or caution for the tech-tenacious, Davis pointed us all to the indisputable fact that it’s okay to look to new technologies to address old problems in development as long as we are all aware that any new process, tool, or approach has just as much potential to fall flat as did their predecessors. The successful integration of M&E and ICT is fully reliant on sound monitoring and evaluation strategies and realistic expectations.


Kevin Flanagan
Kevin Flanagan is a TechChange alum from Technology for Monitoring and Evaluation course. He is a learning technologist on the Monitoring, Evaluation and Learning team at the National Democratic Institute.

yuting.liao
Yuting Liao is senior assistant for data analysis and visualization on the Monitoring, Evaluation and Learning team at the National Democratic Institute.

The National Democratic Institute is a nonprofit, nonpartisan organization working to support and strengthen democratic institutions worldwide through citizen participation, openness and accountability in government.

Featured image: Wayan Vota Flickr

In August, along with announcing our Tech for M&E Diploma program, we kicked off a M&E Professionals Series, where we will be talking one-on-one with M&E professionals to give you the inside scoop on the industry.

For this second post in the series, we are featuring an interview that one of our alumni, Stephen Giddings conducted, with Janet Kerley, Senior Director, Monitoring and Evaluation Practice at Development and Training Services, Inc (dTS), a Virginia-based consulting organization that does considerable work with USAID.

Janet Kerley
Janet Kerley is a master evaluator and an accomplished trainer in evaluation and performance measurement. As Senior Evaluator in the Monitoring and Evaluation Practice at dTS/Palladium, she provides technical leadership for evaluations in the ME unit, provides technical direction on design and field methods, and supervises the preparation of the evaluation reports. As Chief of Evaluation, Research and Measurement for the Peace Corps, she established an impact evaluation system at Peace Corps.

Ms. Kerley was the Team Leader for Monitoring and Evaluation in the Office of the Director of Foreign Assistance, US Department of State, leading a 200-member inter-agency team to develop standard indicators for the 2007 Foreign Assistance Reform reporting tool. She worked at USAID in the Bureau for Policy and Program Coordination, CDIE and as the Monitoring and Evaluation Office in the Bureau for Africa and the Bureau for Europe and Eurasia. Prior to joining USAID, Ms. Kerley was a Senior Research Associate at Aguirre International. She has lived and worked in many countries in Latin America, Africa

S: How has technology changed the way M & E is conducted over the past decade in international development?
J: The change has been remarkable! A decade ago, most of the data gathering and analysis work was all paper-based, making it difficult, time-consuming, and costly. Especially in overseas environments, it took considerable time and effort to gather, transcribe (and often translate) and analyze the data. But today, the tech tools have made data collection and analysis more efficient and save time and money.
However, there is still a considerable “digital divide” between the much more tech savvy young people and the older professionals originally trained using SPSS (or even earlier)
technologies.

S: Does paper-based data collection still have a place in M&E today?
J: Yes — in certain circumstances paper-based data collection may be preferred.

In very rural areas where electricity may not be available, where batteries for electronic devices cannot be charged or where internet connections or mobile phone services is inconsistent or not available, paper-based data collection is still the best option.

Not everyone is comfortable with data collection using electronic devices, but they may be more open to paper-based questions.

S: What are some of the pitfalls of some of the popular tech-based data collection tools?
J: With so much tech available, it is easy to get carried away.

Some less experienced or less than fully trained data gatherers may lose sight of the fundamental questions the monitoring or evaluation is trying to get at. If evaluators lack sufficient training in sound principles of research, they may be tempted to substitute technology for sound reasoning and good judgment.

Some data collection tech tools may also have a tendency to collect too much data, some of which may be irrelevant to the task at hand. USAID, in particular, is burdened by data overload where data management systems fail to filter out data that is of little use and complicates the monitoring and evaluation practices.

S: What challenges have USAID Missions faced when integrating new technologies into their M& E functions?
J: By and large, USAID Missions have been quite open to technological improvements to M&E functions. That said, there is still a “digital divide” where younger employees (including local staff) who have grown up in the digital age are more comfortable with and more adept at using new technologies to enhance M & E. But more senior and older USAID staff seem generally open to embracing and appreciating the advantages that new technologies can bring to M & E while leaving the technical analysis and the new data gathering tools to younger techie staff. USAID staff have generally been very receptive to training in using new M & E technologies to their advantage.

S: Have new evidenced based technologies made decision making by senior USAID staff easier and more informed?
J: Most USAID Mission Directors recognize the value that good evidence on performance can bring to the achievement of program results, and the added clarity that good data and visually well-presented documentation can bring to decision making.

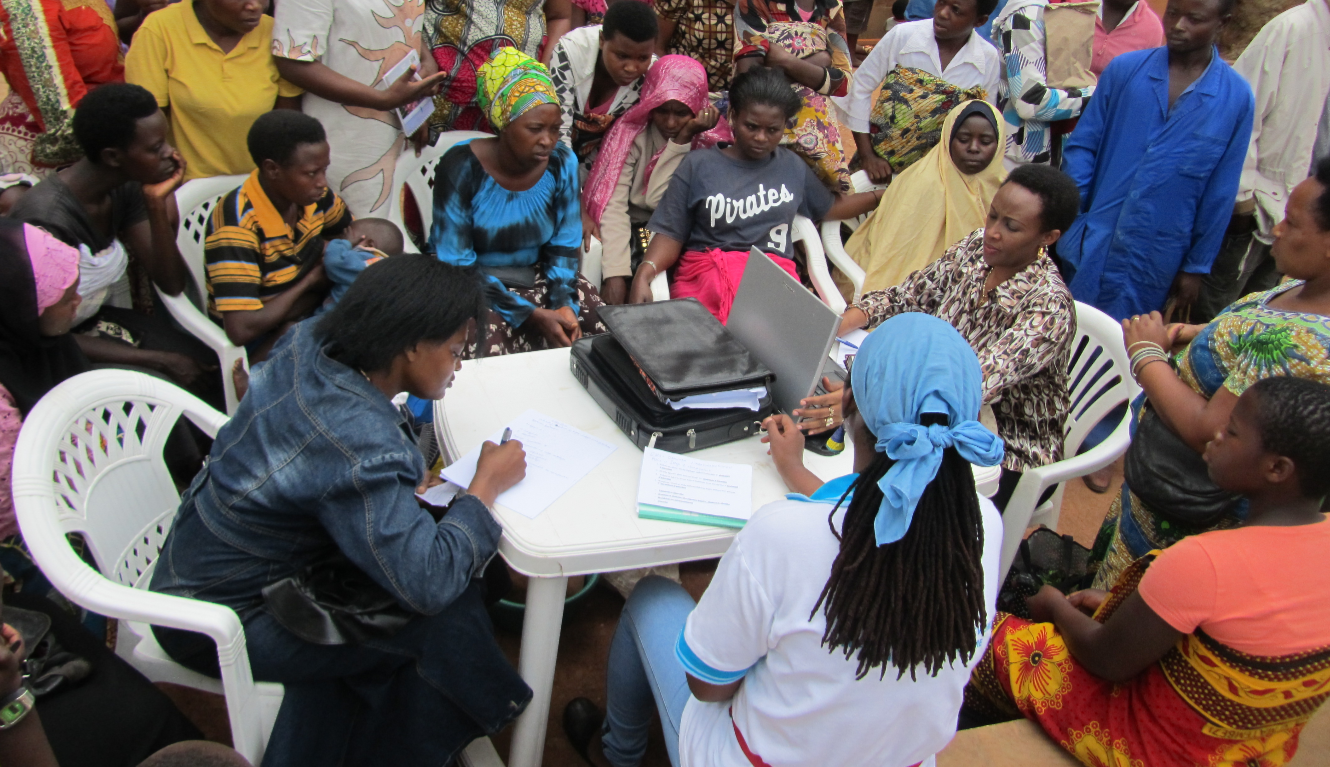
UNDP in Kigali, Rwanda (Creative Commons image)Photo Source: UNDP in Kigali, Rwanda

S: What are the advantages of mixed methods evaluations?
J: The most important starting point for an evaluation is doing the research required to understand what questions you want answered. Only then should you begin to look at evaluation methodologies to acquire necessary information.

When done at a proper scale, well executed quantitative data collection and analytical methods can bring statistical rigor and clarity. For example, the scale of some of the evaluations done for USAID’s food security (Feed the Future) programs has generally provided reliable data. Unfortunately, USAID Missions sometimes do not make available sufficient budget to assure that sample size for quantitative methods is sufficient to draw reliable conclusions. This is where qualitative methods can help to fill gaps.

Storytelling, an evaluation tool, is one of the most useful qualitative data collection methods. Sometimes quantitative data collection methods do not allow beneficiaries to open up and provide adequate and reliable information, but they react much more positively if they are allowed to tell a story. If you get enough good stories they can provide insights and nuances that purely quantitative methods cannot. Thus mixed method evaluations can provide more reliable evidence of performance than quantitative or qualitative methods.

S: Do you think there is a bias towards quantitative methods in international development because of a lack of free and easy to use qualitative tools?
J: Not at all. Many USAID evaluations make good use of qualitative methodologies. A
decade ago, there was an overuse of “the windshield wiper” approach (an evaluation that is not given time to do adequate field work and they report what they observe “through the windshield.”) to evaluations but more recently qualitative methodologies have become more sophisticated and reliable and can provide a lot of extremely useful information for decision makers.

S: What questions should we be asking to select the best technology for M & E?
J: Evaluation planning should begin with framing the research questions — what is it that we need to learn? The preferred technological solution should be one that can best answer the research questions and must also take into account cultural sensibilities. It is very crucial that technology be viewed as a tool, and not as a substitute, for knowing the basic principles of research.

StephenIDphoto
Stephen Giddings, a TechChange alum, has served for 25 years as a Foreign Service Officer with the USAID, retiring in late 2005. For most of his USAID career, he specialized in managing housing and urban development programs, serving in USAID offices in Panama, Kenya, Cote d’Ivoire, Russia and Rwanda, as well as Washington, D.C. During his last four years with USAID he was the Chief of the Policy Division for USAID’s Africa Bureau.

For the past ten years Mr. Giddings has been an independent consultant providing assistance to the Development Assistance Committee (DAC) of the OECD, and consulted with USAID, the International Real Property Foundation (IRPF), among other international development organizations. He serves on the Development Issues Committee of the USAID Alumni Association and is Co-Chair of the Africa Work Group in the Society for International Development’s Washington, D.C. Chapter (SID-Washington). Prior to his USAID career, Mr. Giddings managed low-income housing development programs at the U.S. Department of Housing and Urban Development and was Director of Planning and Development at the Boston Housing Authority. Mr. Giddings received a BA in political science from Wesleyan University and an MPA degree from the Maxwell School of Citizenship and Public Affairs at Syracuse University.

——-

Hope you enjoyed our second installment of our M&E Professionals Series! Don’t forget to follow our blog for the next post in the series!

Interested in engaging in similar conversations with M&E professionals like Stephen and Janet? Join us in our upcoming course TC211: Technology for Data Collection and Survey Design that starts on October 19. If you want the whole package, you can join our second session of our Tech for M&E Diploma program

3D printers make creating new prosthetic limbs look easy. Smart systems enable farmers to perfectly plant, fertilize, water and harvest their fields. Innovative analytical tools allow governments, NGOs, and businesses to see trends like never before, and cloud computing technologies allow the terabytes of information created daily to be shared from partner to partner across the globe. Worldwide, Information and Communications Technology (ICT) increases output and productivity.

If utilized effectively, these technologies will build the capacity necessary to achieve the United Nations’ Sustainable Development Goals (SDGs) for 2016-2030, lifting millions out of extreme poverty as we move toward a healthier, brighter, global future. The SDGs expand upon the foundation laid by the 2000-2015 Millennium Development Goals (MDGs) by taking a more holistic approach to development issues and approaching economic, social, and environmental development as pieces of the same puzzle.

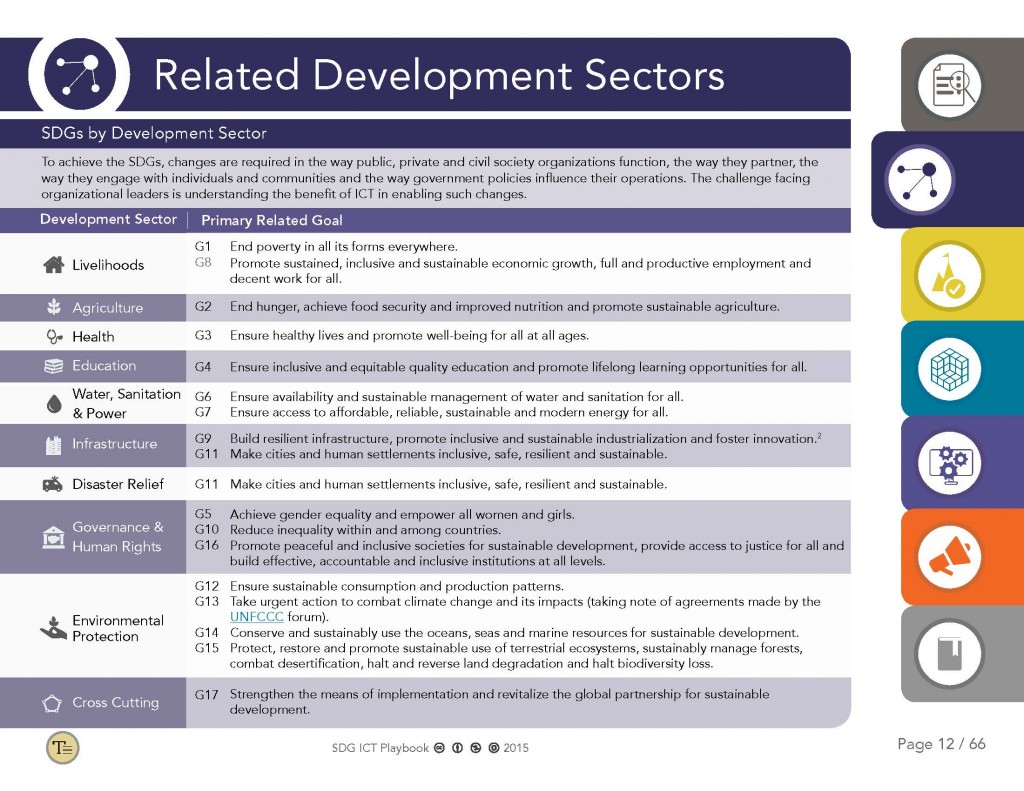
NetHope_SDG_ICT_Playbook_Final_Page_12

The SDG ICT Playbook guides organizations in the development sector as they leverage the power of ICT to achieve these goals, providing the context for:

  • Governments to build new, innovative, and sustainable ways to connect their populations to technology, thus enabling improved connection with their citizens, making processes more transparent, democratic and efficient, and improving the accessibility of government services.
  • NGOs to utilize this new suite of tools to conduct better research, plan more effective initiatives, and analyze their impact.
  • Entrepreneurs to enter into emerging markets with innovative products in an efficient, cost-effective manner that supports sustainable development.

In our work toward the SDGs, all actors should support policies, within organizations and on a national and international level, that make technology more accessible to the public.

We must create cross-sector partnerships to build the infrastructure that makes ICT possible and use those partnerships to enhance the efficacy of ICT solutions. From businesses, to governments, to organizations focused on agriculture, health, education, WASH & power, disaster relief, and environmental protection, we all stand to gain from it wouthe increased use and availability of ICT.

Acknowledging that organizations within the ICT field are situated to lead the charge on technology’s accessibility, the SDG ICT Playbook was spearheaded by a partnership between NetHope, Catholic Relief Services, Intel, Microsoft, CDW, and TechChange. While we all occupy a diverse array of organizations, we believe that our institutional differences are what give us, as a group, the holistic view that technology needs to be made accessible from a variety of perspectives, in order for it to be accessed by a variety of potential users.

Check out NetHope’s press release and blog post about the playbook.


We are excited to start our fourth iteration of our most popular online course, Technology for Monitoring and Evaluation! We wanted to ask some of our alumni who have taken the course with us what they got from the course. Here is what they had to say:

Ladislas Headshot
Ladislas Hibusu
Consultant at Zhpiego (Zambia)

This is the course that landed me a Monitoring and Evaluation consultancy job with Jhpiego as I approached the interview room with much tech knowledge and courage beyond my previous experiences.

Sahibzada Arshadullah
Senior Manager M&E at Cowater International Inc (Pakistan)

This is a must course for the M&E practitioners, where they can get hand on experience using various latest tools and softwares necessary for data management, real time monitoring, and evaluation. Due to the ever increasing role of information technology in the development sector as well the beginning of the big data era, it has become important for M&E related professionals to exploit the latest technological advancement and equip themselves with the right tools and software to compete in the global market.

ARumsey CABI cropped
Abigail Rumsey
Content Developer (Technical Solutions) at Plantwise Knowledge Bank (UK)

The community created around this course is the most valuable aspect. There are people from all around the world sharing their experiences and knowledge, and learning together.

Niamh Barry
Niamh Barry
Global Lead on Monitoring and Evaluation at Grameen Foundation (Uganda)

This course was fantastic. The platform of engagement was the best i have experienced, you feel part of a community and it is so engaging (this is coming from someone who has lost interest in a few online courses before!). The facilitators, demos and guest speakers were well chosen. Do this course if you are just starting in Tech and M&E and if you have already started it, it will show you how much more there is to learn and inspire you to try new innovations in your work.

Robert Kolbilla
Robert Kolbila
M&E Manager, Mennonite Economic Development Associates (Ghana)

Enrolling in this course has just opened a new career path for me as development practitioner. I have been exposed to modern tools and techniques that is fast changing the face of M&E in development practice globally. I was a Nutrition Coordinator at my organization when I joined the course, and now have transitioned to M&E Manger of a $20 million project. This course has been life changing for me.

Want to be our next success story? Our next Tech for M&E online course begins next week! Save your spot now!

We have equipped around 6000 alumni with similar skills around the world in many of our other courses. To help our community grow even further, we are taking a step beyond a 4-week online course, and offering a brand new diploma program in Tech for M&E. Check it out here!


Are you a techie looking to make a difference in the world?

We’re excited to announce that applications for TechChange Summer Fellowship 2016 are now open! This summer, we hosted our first class of tech fellows at the TechChange headquarters and are looking forward to our next class.

The fellowship is open to recent graduates and rising college juniors and seniors. The fellowship provides practical training in web development as well as a unique exposure to a range of applications and organizations using technology to tackle a variety of global challenges — from creating prosthetic limbs with a 3D printer to combating malaria with mobile devices.

As a fellow, you will spend three months designing and implementing a web development project related to education, technology, and social good. TechChange staff will provide training, mentorship, and a series of events to support you in this process.

Read our summer 2015 fellows, Nithya and You Jin’s experiences on our blog. Visit our fellowship page to learn more and apply to be a 2016 Fellow!

Applications are now open and due February 15, 2016. Email any questions to fellowship [at] techchange [dot] org. Please note that we are only able to consider applicants with American citizenship or a valid work visa in the United States.

If you have taken a TechChange course, you know that the participants are all doing amazing things wherever they are in the world. Some go on to start their own organization, some collaborate with other participants for future projects, and some take what they learned in the course and apply it in their current projects. Ameneé Siahpush took our Tech for M&E online course in January and has since been leading tech integration in Trickle Up’s M&E programs.

Tell us about yourself

A: I’m a Pacific Northwesterner who moved to New York City in 2010 after spending the prior few years in Latin America. My current role at Trickle Up is Senior Monitoring & Evaluations (M&E) Officer, where I support our economic and social empowerment programs in India and Central America. My work aims to increase our understanding of sustainable livelihood development for highly vulnerable populations, including outcomes around food security, health, coping mechanisms, and social empowerment. I’m particularly interested in expanding our use of participatory methods to improve and deepen our program learnings and developing simple mechanisms for sharing knowledge across participants, partners, staff, and offices. (If you have any ideas, please let me know!)

What does Trickle Up do?

A: Trickle Up is an international NGO that works to create a world in which it is unacceptable for anyone to live in extreme poverty. In collaboration with local partner organizations, we empower and support the poorest and most vulnerable people to develop the confidence and knowledge to build sustainable livelihoods by 1) providing training, coaching, and seed capital grants to jumpstart microenterprises; 2) forming savings and credit groups to build financial capital and literacy; and 3) improving access to information and financial, health, and social services. We also provide technical assistance to other development organizations and government agencies to help them deliver social empowerment and economic programming that reaches “last mile” populations, including women, people with disabilities, and marginalized ethnic populations living on under $1.25/day in rural areas. Trickle Up currently works in India, Central America, South America, West Africa, and the Middle East.

How did you hear about TechChange?

A: My colleague at Trickle Up learned about the Technology for M&E course through a Yahoo M&E group, and quickly forwarded me the information given my interest in the topic.

Why did you decide to enroll in the Tech for M&E course?

A: I feel very fortunate to work for an organization that has invested in a robust M&E system, including the use of mobile data collection for some of our projects. However, as we scale our programs, it’s essential that we adapt our M&E systems to become more efficient and effective across an increasingly large and diverse number of partners and program participants. Integrating new technologies and tools is key in this adaptation process – yet, I knew that I needed very practical guidance in understanding which combination of technologies and tools would be best suited for Trickle Up’s current and future programs. The Tech for M&E course felt like the perfect companion for exploring these issues. It offered practical tools and resources, connection to a wide network of experts, forums to collaborate with other NGOs, and flexible access to course materials to accommodate my travel schedule. I also really appreciated that the discussions were geared towards international organizations who often work in remote, rural places where connectivity and electricity challenges must be considered in their M&E tools.

How has the course impacted your work at Trickle Up?

A: I entered the course with a deep interest in exploring technologies to increase the efficiency and quality of our M&E data. I came out of the course with the language, framework, tools, and resources to actually take the lead in designing and implementing new technologies within Trickle Up’s M&E system. Since completing the course, I have successfully added “M&E tech upgrades” into our upcoming year’s strategic plans. This includes a detailed roadmap of how we will integrate and utilize mobile data collection and a data visualization/reporting platform across all of our projects to increase access to real-time data for project management, promote cross-regional learning, and, ultimately, improve our ability to direct resources towards combating extreme poverty. Yes, it’s a very lofty goal, but one that is greatly enabled by simple technologies that help to ensure our program data is more efficiently and effectively used.

What would be an advice to other participants taking a TechChange course? How can they get the most out of it?

A: If possible, approach the course with a specific, tangible challenge that you hope to confront in your daily work. Keep this challenge in mind as you choose which webinars to attend or resources to explore, and then organize your course notes in a way that will be easily accessible in the future.

Another obvious, but important, suggestion is to be an active participant! Connect with fellow students, ask questions, follow up with presenters, experiment with the recommended tools. Luckily, the course provides a wide variety of ways to engage with the materials and people, despite being in different time zones, and everyone felt very approachable and enthusiastic. We’re all current or future tech nerds, after all.

You can join participants like Ameneé in our next Tech for M&E course in September. If you are looking to dive deeper, check out our brand new Diploma Program in Tech for M&E

About Ameneé
Amenee
Ameneé is the Senior Monitoring & Evaluations Officer at Trickle Up, where she supports their economic and social empowerment programs in India and Central America. She holds a BA in sociology and psychology from the University of Oregon and an MPA, with a specialization in international policy and management, from the Wagner School of Public Service at New York University (NYU). As an NYU Gallatin Global Fellow in Human Rights, Ameneé partnered with Global Workers Justice Alliance to conduct research on gender and migration in Oaxaca, Mexico, and has spent multiple years in Latin America, more broadly, volunteering with small-scale farmers and studying Spanish. Prior to Trickle Up, Ameneé was a Program Evaluator at Morrison Child & Family Center in Portland, OR, and a Research Supervisor at the Oregon Social Learning Center. Outside of work, Ameneé loves to play soccer, dance, and spend time in the mountains.

There are many lessons to be learned from on-site organizations doing implementation.

As a personal account, I was recently reflecting on exploratory calls I conducted while at Results for Development (R4D). Water, sanitation and hygiene (WASH) organizations had a thing or two to say about how data and mapping technologies influence their work.

One trend I noticed was that innovative WASH organizations felt their voices were not being heard in Washington D.C. During the calls, they explained how they needed a new means of communicating with large donor and funding organizations. The solution? Data.

Data has caused a craze, a buzzword for new bandwagon technology enthusiasts. However, we must proceed with caution. Like a previous post on TechChange, The Case for Gender Data, research questions and our own cultural frameworks can easily slip in and create a biased data set, even with general survey assessments for water, sanitation and hygiene challenges.

From my experiences collaborating with organizations in South Sudan, Uganda, Kenya and India, similar themes presented themselves. The encroachment of new ‘innovative’ technologies and the cutthroat need for greater data collection has turned social good work into a narrow-minded desire to show off results rather than produce long-term outcomes.

Water quality and sanitation organizations feel the pressure to collect more data to prove their work’s success through the ‘x’ number of water pumps rather than ‘x’ amount of water being used. (Water Forever or Maji Milele translated in Kenyan, is a unique organization that addresses this issue through the sales of prepaid water meters to water utility companies in Kenya).

This means that maps need a skeptic’s eye, too. GIS applications have become a runner up in the bandwagon club. Maps are only as good as its data and the underlying story it tells. Too many maps in the field of International Development are merely tracking funding allocations and project placements rather than highlighting practical analysis tool sets to benefit socially marginalized populations.

Nonetheless, I have learned from working in this space that data collection, monitoring outcomes and mapping visualizations can most certainly help address water issues, but by no means is the solution.

Innovative technologies can help address the water and sanitation crisis but it’s not a ‘Silver Bullet’ Solution that will change broader social and political structures. It’s when these tools have real world applications to support policy and resource management that new mapping technologies are better equipped to get things done.

A great example of this is IWMI. International Water Management Institute (IWMI) is a pioneer in the field of international water and ecosystem management research. IWMI creates practical tools that are free and open to the public to help address water related issues through climate change vulnerability assessments, groundwater quality monitoring and water resource management.

These are three examples of mapping tools that are initiating a movement towards practical mapping applications with analysis that goes beyond just a point on the map.

“The Himalayan region is considered to be very sensitive to climate change due to the high variation in altitudes. Changes in cloud cover and rainfall, particularly over land; melting of icecaps and glaciers and reduced snow cover are some of the prominent threats due to rise in temperature. “

“The main objective of this study was to identify and prioritize sub-basins/watersheds in the Middle and High Mountains of Nepal that are significantly vulnerable to Climate Change (CC). ”


“The absence of perennial rivers or major water supply schemes to the Peninsula highlights the importance of groundwater as the predominant water resource for domestic, industrial and agricultural use. Intensive irrigation, higher inorganic fertilizer usage and a comparatively dense population may result in over-extraction of groundwater resources and a deterioration of the water quality over time.”

“The objective of this study was to characterize the chemical quality of the Chunnakam aquifer, map the spatial distribution of water quality and making the information easily accessible to future research studies and water/land-use managers.”


“The Water Information System for Sri Lanka aims to provide a web-based framework with access to information on water resources in Sri Lanka in order to ensure the sustainable use and efficient management of water resources. Information on Sri Lanka’s available water resources, how it is changing over time in quantity and quality, the present and future demand for water resources, and how climate change is impacting the overall situation of available water resources.”

If you’d like to learn more about mapping, I encourage you to sign-up for TechChange’s newest Mapping for Social Good certificate course and to join the conversation with me on Twitter at @EvaAdler44 and @TechChange.

Image Source: AidData

How do you analyze data you collect from surveys and interviews?

One way to analyze data is through data visualizations. Data visualization turns numbers and letters into aesthetically pleasing visuals, making it easy to recognize patterns and find exceptions.

We understand and retain information better when we can visualize our data. With our decreasing attention span (8 minutes), and because we are constantly exposed to information, it is crucial that we convey our message in a quick and visual way. Patterns or insights may go unnoticed in a data spreadsheet. But if we put the same information on a pie chart, the insights become obvious. Data visualization allows us to quickly interpret the data and adjust different variables to see their effect and technology is increasingly making it easier for us to do so.

So, why is data visualization important?

Patterns emerge quickly

Cooper Center's Racial Dot Map of the US
Cooper Center’s Racial Dot Map of the US

This US Census data (freely available online for anyone) is geocoded from raw survey results. Dustin Cable took the 2010 census data and mapped it using a colored dot for every person based on their race. The resulting map provides complex analysis quickly.

It is easy to see some general settlement patterns in the US. The East Coast has a much greater population density than the rest of America. The population of minorities is not evenly distributed throughout the US with clearly defined regional racial groupings.

Exceptions and Outliers are Made Obvious

San Luis Obispo, CA

As you scan through California, an interesting exception stands out just north of San Luis Obispo. There is a dense population of minorities, primarily African-Americans and Hispanics. A quick look at a map reveals that it is a men’s prison. With more data you can see if there are recognizable patterns at the intersection of penal policy and racial politics.

Quicker Analysis of Data over Time


Google Public Data Explorer

Google’s dynamic visualizations for a large number of public datasets provides four different types of graphs, each with the ability to examine the dataset over a set period of time. It is easy to see patterns emerge and change over time. Data visualization makes recognizing this pattern and outliers as easy as watching a short time-lapsed video.

What are some of your favorite data visualizations examples or tools, tweet at us @TechChange or share in the comments section below.

If you are interested in learning about how to better visualize and analyze data for your projects, join us in our new online course on Technology for Data Visualization and Analysis. The course begins on June 1, so save your seats now!