By Timo Luege, TC103: Tech Tools and Skills for Emergency Management facilitator

As technology for disaster response evolves, digital mapping is playing an increasingly important role in helping emergency managers in humanitarian emergency response operations. When considering the best tools and skills to respond to the Ebola crisis in West Africa, earlier this year, Doctors without Borders/Médecins Sans Frontières (MSF) sent a dedicated Geographic Information Systems (GIS) officer to Guinea, to support the local and international medical teams who are fighting the Ebola-outbreak. To find out whether that was a good investment, the MSF GIS Unit asked TC103 facilitator Timo Luege to write a case study showing the impact of this field-based GIS officer.

Some of the key observations are:

  • Most of the the areas close to the border of Guinea, Liberia and Sierra Leone had not been mapped previously. This meant that it was very easy to see the changes.

  • Despite being in a very remote area, the GIS officer had decent internet connection which allowed him to reach out for remote support. Among other things this made it possible for the volunteers of the OpenStreetMap community to contribute directly to supporting the response. So this is also a case that shows what crowdsourcing can contribute to humanitarian emergency response.

  • Since the GIS Officer was in the field, he and his local staff were able to provide context to the basemaps that were produced remotely. Both components were important: without the remote support, the GIS wouldn’t have been able to create all basemaps at the granularity that is available now. But without the GIS in the field, a lot of the traced outlines would not have been meaningful, because you need local knowledge to know whether a building is a school, a hospital, a police station etc. Also: assigning the correct names to villages is at least as important as mapping roads. Again, you need people in the field to do this.

  • Because MSF chose to use formats and tools that encourage or even require sharing, many maps created for MSF will add value to local communities, local government and help other humanitarian and development organizations working in the area. This means that the outputs will continue to be beneficial and can be built upon.

You can download the complete case study here:

GIS Support for the MSF Ebola response in Guinea in 2014

GIS Support for the MSF Ebola response in Guinea in 2014

This post originally appeared in Social Media for Good

Interested in learning more on how to use digital crisis mapping tools for humanitarian emergencies and natural disasters? Enroll now in this online course on Mapping for International Development and Tech Tools & Skills for Emergency Management.

About the TC 103 facilitator: Timo Luege

Timo Luege

After nearly ten years of working as a journalist (online, print and radio), Timo worked four years as a Senior Communications Officer for the International Federation of Red Cross and Red Crescent Societies (IFRC) in Geneva and Haiti. During this time he also launched the IFRC’s social media activities and wrote the IFRC social media staff guidelines. He then worked as Protection Delegate for International Committee of the Red Cross (ICRC) in Liberia before starting to work as a consultant. His clients include UN agencies and NGOs. Among other things, he wrote the UNICEF “Social Media in Emergency Guidelines” and contributed to UNOCHA’s “Humanitarianism in the Network Age”. Over the last year, Timo advised UNHCR- and IFRC-led Shelter Clusters in Myanmar, Mali and most recently the Philippines on Communication and Advocacy. He blogs at Social Media for Good and is the facilitator for the TechChange online course, “Tech Tools & Skills for Emergency Management“.

by Timo Luege, TC103: Technology for Disaster Response facilitator

Wouldn’t it be wonderful if all public social media messages in a disaster would come with a flag that identifies them as relevant? The Office for the Coordination of Humanitarian Affairs (OCHA) is trying to pave the way for that with the brand new Hashtags Standards for Emergencies.

UNOCHA Hashtag Standards for Emergencies

The document builds on experiences gained in the Philippines where a set of standard hashtags such as #RescuePH or #ReliefPH have become so commonly used, that the government recently endorsed these as “official” disaster response classifiers to help identify needs. OCHA is now trying to elevate this system to the global level in the hope that we will start to see more consistency across countries and disasters. If successful, this hashtag standards could help disaster responders and their supporting software systems identify needs more quickly and reduce the amount of time needed to find relevant messages in flood of updates.

OCHA proposes three different types of social media hashtags:

  1. Disaster title hashtags. This type of hashtag (e.g. #Sandy) would be used by anyone to generally comment on an emergency (e.g. Hurricane Sandy) and would not be actively monitored by response agencies.
  2. Public reporting hashtags. By suggesting a specific hashtag that citizens can report non-life-threatening emergency items they see (e.g. #311US for broken power lines or a damaged bridge in the USA), we would be making sensors of the entire population. The resulting data could be scanned, mined and filtered to the relevant responding agencies.
  3. Emergency response hashtags. By providing a standard hashtag to trigger emergency response, based on local standards (e.g. #911US for the USA), we would enable citizens to tag content that is absolutely critical.  It would also enable responders to set up dedicated social media monitoring tools and channel the resulting information into their already existing mechanism(s). Social media would become an official information source.

(source: verity think)

I think this is great initiative and governments should pick up the ball and use this document as guidance for their own national strategies. That national authorities make this their own is essential because it can only work if the affected population knows about these hashtags in advance of the disaster and if the hashtags have been localized.

The graphic the report uses to illustrate the idea for the Ebola response is a good case in point:

Standard Hashtag

The suggested hashtags seem pretty straightforward until you take into consideration that Guinea is French speaking, meaning that people there probably will use something like #EbolaBesoin instead of the English #EbolaNeed.

Of course that would still be a huge step forward, since it would increase consistency even in cases where an emergency spans multiple countries and languages. After all, a limited number of hashtags that are used in multiple languages is still much better than no system. But it also shows that this document is not so much a blueprint as a concept study. It is now up to governments and other national disaster response organizations to make it work.

Interested in learning how social media and other technologies can help with disaster response? Enroll now to lock in your early bird rate for our Technology for Disaster Response online course that begins June 22.

This post originally appeared in Social Media for Good

About the TC 103 facilitator: Timo Luege

Timo Luege

After nearly ten years of working as a journalist (online, print and radio), Timo worked four years as a Senior Communications Officer for the International Federation of Red Cross and Red Crescent Societies (IFRC) in Geneva and Haiti. During this time he also launched the IFRC’s social media activities and wrote the IFRC social media staff guidelines. He then worked as Protection Delegate for International Committee of the Red Cross (ICRC) in Liberia before starting to work as a consultant. His clients include UN agencies and NGOs. Among other things, he wrote the UNICEF “Social Media in Emergency Guidelines” and contributed to UNOCHA’s “Humanitarianism in the Network Age”. Over the last year, Timo advised UNHCR- and IFRC-led Shelter Clusters in Myanmar, Mali and most recently the Philippines on Communication and Advocacy. He blogs at Social Media for Good and is the facilitator for the TechChange online course, “Technology for Disaster Response.

By Michael Baldassaro, Innovation Director at Democracy International

On Sunday October 26, 2014, more than three million Tunisian voters cast ballots in parliamentary elections, marking an historic milestone in the country’s remarkable transition from authoritarian rule to democracy. To support the election process, international and Tunisian civil society organizations deployed thousands of observers on Election Day.

One of the Tunisian observation groups, I Watch, recruited, trained, and deployed hundreds of observers nationwide on Election Day. While recruiting, training and deploying observers is a necessary – and human and financial resource intensive – practice in an election observation exercise, I Watch decided to take a bit of a different approach. In their own words:

“Election observation has become a costly, top-down and exclusive exercise that largely ignores citizen input and participation for legitimising the process. I Watch aims to counter this through an inclusive and technologically innovative approach which could revolutionise election observation worldwide.”

I Watch e-Observation Promo

I Watch promotion for e-observation

With support from Democracy International and Ona, I Watch conducted a “hybrid pilot [that] combines domestic observation with crowdsourcing tools to provide a new way of engaging citizens in the electoral process.” As a youth-led organization with a mission to increase citizen participation in public life, I Watch set out to provide all Tunisian citizens interested in safeguarding their own elections with the opportunity and the skills to do so.

Six weeks prior to Election Day, I Watch held a press conference to launch its e-observation platform where citizens could create profiles and register to be observers. Within a week of the launch, more than 600 citizens signed up to be eligible as I Watch observers. By Election Day, 1,318 citizens from all 24 Tunisian governorates registered through the E-Observation platform, of which 1,215 were ultimately accredited as I Watch observers.

Unlike a typical election observation project, in which observers are trained face-to-face through a national day of training or series of training workshops throughout the country, I Watch produced a series of videos to educate citizen observers on the goals of election observation, the roles and responsibilities of an election observer, the opening, voting, closing and counting processes on Election Day, and instructions for transmitting observer findings.

E-Observation Training Video: What is Election Observation?

Applying an e-learning model greatly reduced the amount of human and financial resources typically associated with training observers: depending upon the size of an election observation mission, or the size of the country in which it takes place, costs for training observers can be prohibitively expensive – sometimes hundreds of thousands of dollars. It also enabled observers to learn at their convenience while preserving a measure of quality control that can be lost when a training-of-trainers or step-down training approach is used.

After observers watched all the videos, they were required to take a quiz to test their
aptitude and ensure that they had understood all the necessary steps to be effective observers. If an observer passed the quiz, s/he was then accredited as an I Watch observer. If an observer didn’t failed the quiz, s/he could re-watch the videos and take
the quiz again.

To collect and analyze observer findings, I Watch used two completely free and open-source information and communications technology (ICT) applications: Ona and SMSsync. Observers submitted their findings directly from polling stations via SMS to a customized I Watch Ona platform. I Watch established a “central data center” to analyze findings collected in real-time and proactively contact observers to collect additional information
as necessary.

Democracy International used a similar data collection toolkit called Formhub to collect and analyze data during its January 2014 election observation mission in Egypt. Through the application of key elements of election observation methodology, crowdsourcing techniques, and the use of free and open source ICTs, I Watch was able to increase citizen participation, reduce costs, and make a positive contribution to the electoral process. Given its success during the parliamentary elections, I Watch is planning to move forward with an even better exercise for the presidential elections due to take place in November 2014.

About Michael Baldassaro

Michael Baldasarro

Michael Baldassaro is the Innovation Director at Democracy International. Mr. Baldassaro has a decade of experience designing, managing, and implementing democracy and governance projects in Africa, Asia, and the Middle East. He previously served as DI’s Tunis-based Project Director for the Middle East and North Africa, where he designed projects that use open data, new media, smartphone applications, and crowdsourcing techniques to improve the quality of elections. Before joining DI in 2012, Mr. Baldassaro worked with the National Democratic Institute (NDI) and the Carter Center (TCC) to assist civil society groups in applying statistical principles to election observation using state-of-the-art information and communications technologies, such as mobile data collection technologies, data visualization tools, and social media platforms. Mr. Baldassaro holds an M.A. in International Conflict Analysis from the University of Kent at Canterbury and the Brussels School of International Studies. He is proficient in conversational French.

By Timo Luege, TC103: Tech Tools and Skills for Emergency Management facilitator

As Ebola continues to ravage Sierra Leone, Guinea and Liberia, people from all around the world are working together to stop the disease. In addition to the life saving work of medical staff, logisticians and community organizers, information and communication technology (ICT) is also playing a vital part in supporting their work.

After consulting the TechChange Alumni community and other experts in international development and humanitarian assistance, I pulled together a list of different technologies being applied to manage Ebola. Below are six examples showing how ICT is already making a difference in the current crisis.

1. Tracing outbreaks with mapping and geolocation
Aside from isolating patients in a safe environment, one of the biggest challenges in the Ebola response is tracing all contacts that an infected person has been in touch with. While that is difficult enough in developed countries, imagine how much more difficult it is in countries where you don’t know the names of many of the villages. It’s not very helpful if someone tells you “I come from Bendou” if you don’t know how many villages with that name exist nor where they are. The Humanitarian OpenStreetMap Team has helped this process through creating maps since the beginning of the response.

See: West Africa Ebola Outbreak – Six months of sustained efforts by the OpenStreetMap community.

Monrovia OSM pre-Ebola
Map of Monrovia in OpenStreetMap before and after volunteers mapped the city in response to the Ebola crisis. (Humanitarian OpenStreetMap)

In addition, the Standby Task Force is supporting the response by helping to collect, clean and verify data about health facilities in the affected countries. The information will then be published on UN OCHA’s new platform for sharing of humanitarian data.

2. Gathering Ebola information with digital data collection forms
Contact tracing involves interviewing a lot of people and in most cases that means writing information down on paper which then has to be entered into a computer. That process is both slow and prone to errors. According to this Forbes article, US based Magpi, who just won a Kopernik award, is helping organizations working in the Ebola response to replace their paper forms with digital forms that enumerators can fill out using their phones.

Digital forms not only save time and prevent errors when transcribing information, well designed digital forms also contain simple error checking routines such as “you can’t be older than 100 years”.

If you are interested in digital forms, check out the free and open source Kobo Toolbox.

3. Connecting the sick with their relatives using local Wi-Fi networks
Elaine Burroughs, a Save the Children staff member who is also TechChange alumna of Mobiles for International Development, shared that they are using their local Wi-Fi network to connect patients in the isolation ward with the relatives through video calls. Both computers have to be within the same network because local internet connections are too slow. In situations where video calls are not possible, they provide patients with cheap mobile phones so that they can talk with their relatives that way. Elaine added: “Several survivors have told us that what kept them going was being able to speak with their family and not feel so isolated when surrounded by people in hazmat suits.”

4. Sharing and receiving Ebola information via SMS text messages
I have heard about a number of different SMS systems that are currently being set up. Some are mainly to share information, others also to receive information.

mHero is an SMS system specifically designed to share information with health workers. It works with UNICEF’s RapidPro system, a white label version of Kigali-based TextIt which is one of the best SMS communication systems I know. RapidPro is also at the heart of a two-way communication system that is currently being set up by UNICEF, Plan International, and the Scouts.

The IFRC is of course using TERA to share SMS, a system that was developed in Haiti after the 2010 earthquake and already used in Sierra Leone during a recent cholera outbreak.

5. Mythbusting for diaspora communities via social media
Social media also has a place, though not as much as some people think. With internet penetration at less than 5 per cent in Liberia and less than 2 per cent in Sierra Leone and Guinea, it is simply not relevant for most people – unlike radio for example. However, all of these countries have huge diasporas. The Liberian diaspora in the US alone is thought to be as many as 450,000 people strong – and they all have access to social media. Experiences from Haiti and the Philippines show that the diaspora is an important information channel for the people living in affected countries. Very often they assume that their relatives in the US or Europe will know more, not least because many don’t trust their own governments to tell the truth.
Social media can play an important role in correcting misinformation and indeed, both the WHO and the CDC are using their social media channels in this way.

6. Supporting translations of Ebola information remotely online
Last but not least, Translators Without Borders is helping NGOs remotely from all over the world to translate posters into local languages.

Low tech does it
As a final word, I’d like to add that while technology can make a real difference we must not forget that very often low tech solutions will be more efficient than high tech solutions – it depends on what is more appropriate for the context. So don’t start an SMS campaign or launch a drone just because you can. It’s not about what you want to do. It’s not about technology. It’s about what’s best for the people we are there to help.

A Summary Infographic

TechChange Ebola Infographic

We will be discussing these technology tools, Ebola, and many similar issues in TC103: Tech Tools and Skills for Emergency Management and TC103: mHealth – Mobiles for Public Health. Register by October 31 and save $50 off each of these courses.

Do you have additional examples of how ICT is helping in the Ebola response? Please share them in the comments!

This post originally appeared in Social Media for Good.

About the TC103 facilitator: Timo Luege

Timo Luege

After nearly ten years of working as a journalist (online, print and radio), Timo worked four years as a Senior Communications Officer for the International Federation of Red Cross and Red Crescent Societies (IFRC) in Geneva and Haiti. During this time he also launched the IFRC’s social media activities and wrote the IFRC social media staff guidelines. He then worked as Protection Delegate for International Committee of the Red Cross (ICRC) in Liberia before starting to work as a consultant. His clients include UN agencies and NGOs. Among other things, he wrote the UNICEF “Social Media in Emergency Guidelines” and contributed to UNOCHA’s “Humanitarianism in the Network Age”. Over the last year, Timo advised UNHCR- and IFRC-led Shelter Clusters in Myanmar, Mali and most recently the Philippines on Communication and Advocacy. He blogs at Social Media for Good and is the facilitator for the TechChange online course, “Tech Tools & Skills for Emergency Management“.

Filming of Malaria Consortium staff doctor counselling a client on proper treatment of malaria. Uganda. (Photo credit: Maddy Marasciulo-Rice, Malaria Consortium)

Malaria in Context

There is an undeniable malaria problem in the world today. According to the World Health Organization (WHO) in March 2014, half of the world’s population is at-risk, hundreds of millions of cases are reported each year, and hundreds of thousands die annually of this disease. Around 90% of these cases occur in Africa, with children under 5 years old making up the largest demographic affected.

The burden of this disease on the health care systems of developing countries is immense: Uganda has the highest malaria incidence rate in the world with 478 cases per 1,000 population per year. Fully half of inpatient pediatric deaths in Uganda are caused by this disease and in Nigeria, the most populous African country, 97% of the population is at risk.

(Source: WHO 2013 Global Malaria Report)

How are the countries of Uganda and Nigeria addressing malaria?

While both Uganda and Nigeria have national malaria control and elimination programs, due to long waiting periods and frequent stock outs of the appropriate medications at local health facilities,  individuals prefer to go to private clinics, pharmacies and local drug shops to solve their health needs. When these pharmacists―often untrained in accurately diagnosing febrile illnesses―see a client complaining of fever, they often presumptively prescribe antimalarial medicines. The reverse scenario is also a common problem: pharmacists do not always give out artemisinin-based combination therapy (ACTs) when it is actually needed.

Pharmacists in Uganda

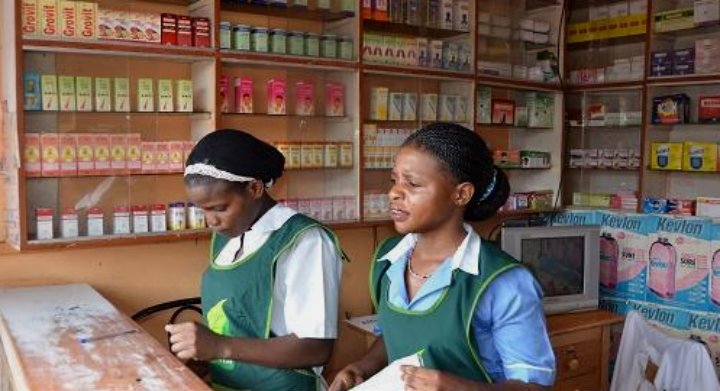
Pharmacists in Uganda assist customers with recommending antimalarial medications (Photo credit: Maddy Marasciulo-Rice, Malaria Consortium)

Presumptive treatment ― the overuse of antimalarials greatly increases the chances that malaria parasite resistance will develop and spread. In the future we might have one less weapon in our arsenal against these parasites. This overuse also means that the medicine is put over

How can rapid diagnostic tests (RDTs) help treat malaria?

Fortunately, rapid diagnostic tests, or RDTs, allow malaria to be diagnosed quickly, accurately, and cheaply, using only a drop of blood and a few drops of a solution. The problem is―there is no official quality control within the private healthcare sector―the pharmacists who provide the RDT to the patient have no way to choose a good RDT from the many options on the market and the wrong choice could lead to inaccurate diagnosis. Furthermore, many of the RDT sales representatives haven’t been trained to properly explain their product to their clients.

Challenges of RDT Training for Malaria in Uganda and Nigeria

RDTs to test for malaria and drugs to treat the disease are currently available in the private healthcare sector. However, there are several challenges to scaling up RDTs in this sector in Uganda and Nigeria.

1. Lack of training with Rapid Diagnostic Testing Materials

The primary barrier to appropriate care is the lack of training among pharmacists and RDT sales providers about how to use the test and interpret the results correctly to effectively diagnose and treat a range of febrile illnesses.

Malaria Consortium, based in the UK, is one of the world’s leading non-profit organizations specializing in the prevention, control, and treatment of malaria and other tropical diseases. Their projects can be found across twelve countries in Africa and Southeast Asia. The organization strives to find effective and sustainable ways to control and manage malaria through research, implementation, and policy development. They came up with the design for a plan that could greatly help manage the disease in both Nigeria and Uganda:

If the RDT sales representatives and RDT providers can be trained to correctly use the RDTs and recognize the symptoms associated not only with malaria but with other common illnesses, then the burden of misdiagnosis and mistreatment can be greatly reduced. Furthermore, as the sales representatives travel and frequently interact with providers, they can act as trainers and further disseminate the knowledge and skills necessary to accurately diagnose and treat these diseases.

2. Prohibitively high costs

The costs associated with arranging such a training are enormous―between transporting the students and teachers to a centralized location, renting a venue, arranging lodging, and coordinating a schedule, the budget for a large-scale training would quickly be out of control. Additionally, pharmacy owners and other stakeholders working in the private sector would most likely have to assume a loss of revenue during their time away from their business while at a training.

3. Technical limitations

An eLearning platform is much more ideal for these circumstances―it’s flexible, participants don’t need to travel far, you need fewer instructors, and the information can be processed at the student’s pace and repeated when necessary. The information is also standardized and consistent, which means that a large number of people can benefit from a high quality training experience.

 But how do you deliver an eLearning course when your audience has intermittent power and whose computers are not only often out-of-date, but lack the RAM, bandwidth, and software standards that such hi-tech learning platforms have come to expect?

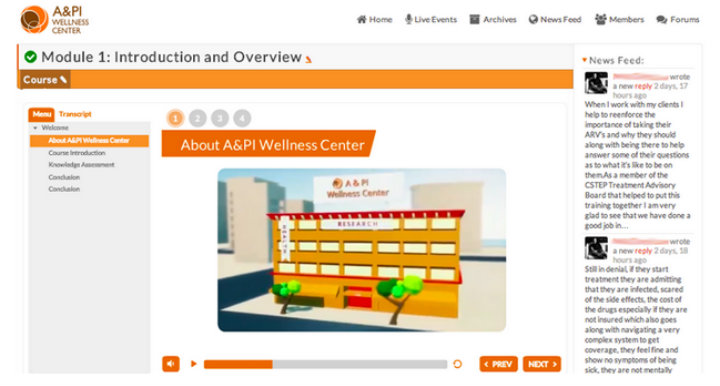
eLearning Solutions for Reaching 3000+ Healthcare Providers for Malaria

Malaria Consortium partnered with TechChange to build a comprehensive digital course to train private sector health workers and RDT sales representatives in this context. This 11 module course includes around 400 slides for 6 hours of content takes participants through the biology behind the malaria parasite, discusses the medical philosophy behind diagnostic practices, and walks users through interactive scenarios for patients presenting a range of symptoms.

Testing TechChange Malaria Consortium modules in Uganda

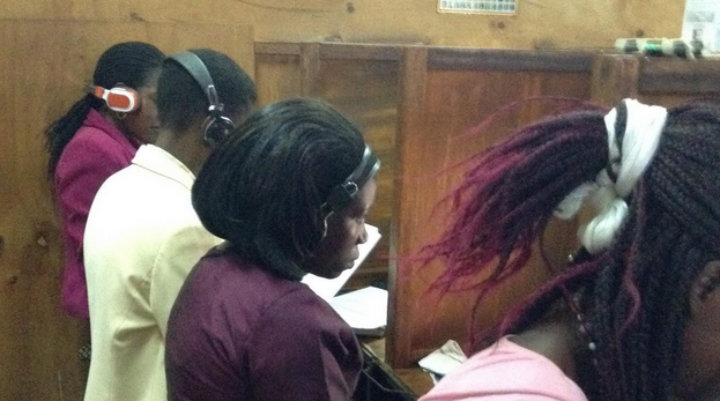
Sales representatives and drug store owners in Uganda testing eLearning modules designed by TechChange and Malaria Consortium on rapid diagnostic testing for malaria. (Photo credit: Catherine Shen, TechChange)

1. Offline access and Ease of Use

Despite significant benefits such as flexibility and scalability, e-learning courses also face challenges in the developing world. Lack of sufficient internet bandwidth, reliable computers, and computer skills can pose major barriers to a training’s effectiveness.

To troubleshoot the technical issues, this course is designed to require nothing more than a computer and headphones – it comes preloaded onto USB drives so not even an Internet connection is necessary, allowing health workers in even the most rural areas to access this training. A computer tutorial is also included for health workers with little to no prior experience with computers. Our tech team is also devoted to helping solve any other technical issues that arise due to out-of-date software and hardware malfunctions, working as a remote IT team as Malaria Consortium rolls out the project.

 2. Localized content

In addition to including the relevant national laws, case studies, and local examples, the narration features Nigerian and Ugandan voice actors, art, and scenarios to make the training as culturally-relevant as possible.

 3. Hybrid learning

Only one part of the training won’t be computer-based; participants will still practice actually conducting the RDT tests in a face-to-face session before they begin pricking patient’s fingers for diagnosis.

The course is designed to reach upwards of 3,000 healthcare providers in the two countries and build their capacity to effectively serve their community’s needs. We look forward to seeing the impact of this training in improving quality of care in Uganda and Nigeria hopefully in the near future.

To learn more about TechChange’s custom training solutions, please contact us at info@techchange.org.

Emily Fruchterman, Catherine Shen, & Charlie Weems contributed to this post.

The Asian & Pacific Islander Wellness Center (A&PI Wellness Center) partnered with TechChange to develop a two-part training course designed for clinical and non-clinical providers to provide HIV education in California. For the first time ever, these trainings combined both the self-paced and facilitated course structures. Participants will be asked to proceed at their own pace through the Articulate Storyline-based APIWC 101 course, before taking part in the four-week facilitated course that features chats with guest experts.


HIV Today – The Context
We have come a long way when it comes to HIV treatment. Thirty years of research and campaigns have transformed HIV from being a death sentence into a chronic condition that permits those who properly manage it to live relatively normal lives. The problem is, only one in four HIV-positive Americans currently follow all recommendations for managing HIV.

According to the Center for Disease Control (CDC), only 25% of HIV-positive Americans reach viral suppression, the current end-goal of HIV treatment. This means that the other 75%, or roughly 825,000 of the 1.1 million Americans estimated to be HIV-positive, are not receiving the support they need to successfully navigate through the obstacles to seek care. As a result, these individuals are not getting the treatments they need to manage and maintain their personal health and consequently, have a greater risk of transmitting the virus to others.

Many agencies have encouraged use of the HIV Care Continuum, also called the HIV Treatment Cascade, as a tool to visualize the proportion of HIV-positive individuals engaged at each stage of care.

HIV Care Continuum

Source: AIDS.gov

This cascade shows an estimated percentage of how many people fall out of care at each step along the way to viral suppression. Nearly one in five HIV-positive Americans do not know their positive status, keeping them from engaging in the cascade at all. Of those that are initially linked to care, nearly half fall out of treatment before being prescribed antiretroviral therapy (ART).

Even more important than this cascade is the breakdown of HIV prevalence by race and sexual preference. African Americans, for example, bear the biggest burden. According to a 2013 CDC report, African Americans makes up 14% of the US population, accounting for 44% of Americans living with HIV. The burden is similarly unequal for other minorities and men who have sex with men (MSM).

CDC estimated rate of new HIV infections (2010)

source: CDC

These statistics highlight the need for responses tailored to the communities most affected by HIV; these groups are more likely to face poverty and racism, as well as distrust with the medical system. When societal challenges are combined with the challenges of navigating HIV, people tend to drop out of care. Diverse communities require varied responses that are culturally aware and take into account the needs of disenfranchised groups.

The Challenge of Scaling HIV Prevention
Response to HIV requires service providers to play clinical and non-clinical roles. Many counselors, social workers, advocates, lawyers, and clinicians frequently work with HIV-positive individuals and in the field of HIV prevention and treatment; it is vital that they understand both the medical and complex social realities faced by their clients.

Born out of a grassroots movement to combat the HIV/AIDS crisis in A&PI communities in the late 1980s, the A&PI Wellness Center works to address the health needs of marginalized and vulnerable groups, regardless of race, ethnicity, gender identity, sexual orientation, or immigration status. In collaboration with Project Inform, the A&PI Wellness Center developed the California Statewide Training and Education Program (CSTEP), a curriculum that sets the standard in HIV treatment and technically and culturally competent training for clinical and non-clinical providers working in the HIV field.

An eLearning Solution

APIWC Module 1

Participants will advance to APIWC 201 upon completion of the first course (APIWC 101). Hosted on TechChange’s facilitated course platform, this online course will provide more in-depth information about barriers to care and supporting clients in a dynamic era of HIV treatment. The month-long 201 course integrates elements of the self-paced course into the facilitated learning environment – participants are able to review the 101 content as well as slides specifically produced for the 201 course, share their knowledge with other providers in the forums, and interact with experts during live events. The ability to work with experts is what really sets this training apart – participants hear from former presidential advisors on HIV policy, specialists in linking HIV-positive people to care, HIV trainers, and those with decades of experience researching the virus and advocating for those affected.

APIWC Guest Expert Dr. Cynthia Gomez

Participants are able to engage with experts such as Dr. Cynthia Gómez (pictured above) during live events. These events are recorded and made available for later review.

The content of both courses is available 24/7 so that providers are able to take part whenever their schedules allow, while the forums and weekly live sessions add a social dimension uncommon in online learning. As all participants have some experience with HIV prevention or treatment, this course provides a unique opportunity for collaborative learning; providers can learn from the experiences of one another, share resources, and strengthen their networks of HIV prevention and treatment specialists.

In the first month alone, the training attracted over 70 participants from a variety of organizations. Additionally, the combined course has little in the way of overhead costs and can easily be repeated or scaled for different audiences, making it a viable strategy for training providers across California, with the goal of improving health outcomes and supporting HIV-positive individuals as they move toward viral suppression.

To register for these free online courses on HIV prevention training, please click here.

Live session recording

Charlie Weems and Emily Fruchterman of TechChange record a live session at the TechChange recording studio in Washington, DC.

Emily Fruchterman, Catherine Shen, Charlie Weems, and the A&PI Wellness Center contributed to this blog post.

If your organization is interested in developing online training with TechChange, please contact info@techchange.org.

With social media technology changing daily, it can sometimes be challenging to keep up with the latest platforms and their newest features, and the seemingly endless stream of content, information, and campaigns.

Recently as we’ve been preparing for the Social Media for Social Change course, we’ve been focusing on the power and limits of “hashtag activism” by examining examples such as #BringBackOurGirls and #YesAllWomen.

Check out the Montreal-based CJAD news radio talkshow interview from last week featuring TechChange’s Director of Marketing, Nancy Ngo, on hashtag activism here:

Hashtags aren’t the only way social media users are advocating for causes. We’ll be analyzing a variety of campaigns and social change movements that have used various social media tools in different ways in our second round of our Social Media for Social Change online course, which begins on Monday, June 16. A very dynamic group of guest expert speakers will join us from organizations such as Change.org, the Resolve LRA Crisis Initiative, Uber, and more. Lawrence Grodeska from Change.org who will share how Change.org has revolutionized online petitions in campaigns such as advocating justice for Trayvon Martin. Resolve LRA Crisis Initiative’s Michael Poffenberger will share his experiences from the Kony 2012 campaign to capture Joseph Kony and draw comparisons with the recent BringBackOurGirls campaign. Alex Priest of Uber will discuss ways that Uber utilizes social media in optimizing urban logistics.

Several participants from many countries including Czech Republic, Jordan, Mexico, New Zealand, Thailand, and across the U.S. have already enrolled in this round of this course, representing organizations such as World Bank Group, USAID, ICRC, World Green Building Council, Oxfam, AARP International, Cornell University, Abt Associates, Chemonics International, Federal Reserve Bank of Kansas City, and many more. All of these participants will be bringing their own perspectives as both social media users and social change advocates for their respective organizations and initiatives.

What’s your take on hashtag activism and social media advocacy? Do you agree with Nancy? Join the conversation with these social media experts and participants across the world to learn more about social media’s role in catalyzing social change. Enroll now in our Social Media for Social Change course here.

By Sairah Yusuf, TC141: Mapping for International Development (Fall 2013) alumna

Before taking this Mapping for International Development course last fall, I had absolutely no previous background on mapping tools, so everything about digital mapping was new to me. For my course final mapping project, I created a digital map of the countries and locations of participants of an international training camp held by Generations For Peace (GFP) in November 2013 (Amman Camp 2013). Given my involvement in evaluating the impact of this training, I wanted a way to visualise the effectiveness of the training.

Here are the steps that I took for my introductory experience in creating a map for my work at Generations For Peace:

Step 1: Define the purpose of your map

Throughout the course, the importance of defining the purpose of your digital map as a first step emerged with debates regarding representation and privacy concerns. My aim with this map is to understand the cascading effect over time of these Generations For Peace volunteers, who will be passing on their skills to new volunteers in their home countries in the Middle East. By maintaining this map from November 2013 to November 2015, I hope that it will be possible to visually demonstrate the geographical impact of this training.

Step 2: Select your dataset

I used data from Amman Camp 2013, including the home country of each individual trained and the geographical reach of the training. I felt that this data was simple enough to work with, given that this was my first exposure to mapping. That said, I had to create the dataset from scratch, entering street addresses/locations for each participant.

Geocoding data in the MENA region proved to be the biggest challenge because geocodes for most street addresses (which were predominantly in Arabic) could not be found in the APIs I used. In addition, we had trainees from the occupied Palestinian territories at the GFP Camp. I struggled with pinpointing their locations on the map since the occupied Palestinian territories did not show up as a country option in many of the geocoding tools I tried. I had to get around this by tagging individuals from this region as hailing from Israel and then manually changing the name later to reflect their location. This issue was important to deal with because I did not want any of these trainees to view the map I had created and feel like I had misrepresented where they were from in any way due to geo-political sensitivities.

Step 3: Select your mapping tool or software

The Mapping course featured a variety of tools including Google Maps Engine, MapBox, Ushahidi, OpenStreetMap, CaerusGeo, and Palantir. I chose the Mapbox/TileMill combination over other options because I felt it allowed me to customise my map more – I could colour in different countries and introduce different levels of interactivity within the map.

Step 4: Choose your design

My design choices were partly shaped by wanting to keep my map easily readable, using block colours and simple labels, and also to keep my map customisation as simple as possible since this was my first mapping exercise. I also wanted the countries in question to stand out quite clearly.

By introducing dots in different colours for new individuals these volunteers train in their own countries, over the course of 2 years, for example, this would show how much of a geographical “spread” the training from Nov ’13 had. It would also help distinguish between volunteers with different levels of training. For example, as time goes on and individuals complete GFP programmes and further training, it is possible to change the colour of the dots representing those who were trained at the original Camp to red, demonstrating their status as a GFP “Pioneer.” Any new volunteers they train can be represented in “blue.” The idea is therefore to improve this map and maintain it over a period of time to represent these changes.

Filling out more details in the second click feature can provide relevant information about each individual – what they’ve done in the past and what programmes they are working on now, for Generations For Peace.

Takeaways:

Basic mapping software can actually be quite accessible, even with very little technical training. However, there’s definitely something of a “glass ceiling” in its use, after which more technical expertise is required. Overall, Mapping for International Development was a really great course, and I’ve already recommended it to others! This online course covers debates in the field in some depth, but also focuses on mapping tools in the field in enough detail to have a platform to build on afterwards.

Are you new to digital mapping as well? Would your work benefit from geographically visualising projects and impact? Register now for our online course on Mapping for International Development.

Bob Corbett’s final mapping project on flood-prone areas in Bangladesh. (Note: this map was prepared as a mapping exercise. Anyone viewing the map should understand that it would need to be reviewed and validated by a qualified expert before it should be relied upon.)

By Bob Corbett, TC141: Mapping for International Development alumnus

During my undergraduate work in Landscape Architecture, I learned a method of analyzing spatial data by overlaying various types of information on acetate sheets or tracing paper developed by Ian McHarg, a Scottish landscape architect. The technique is described here (Note: I am not related to the author). I have always been fascinated by this technique and the GIS capabilities available today make this type of analysis readily possible. This offline overlay technique was the basis of my final mapping project in TC141.

In mid-2011, I launched SMS in Action, an Ushahidi Crowdmap that lists text message based programs worldwide that contribute to the social good. To date, nearly 240 programs classified under 29 different categories have been profiled on SMS in Action and viewed by thousands of visitors from 119 countries. With my general interest in mapping piqued by my Crowdmap experience, I ventured into crisis mapping with the Standby Task Force and more recently, Crisismapper deployments using the Tomnod platform. I have since worked on a variety of crisis mapping efforts from locating refugee encampments in Somalia, to tracking forest and bush fires in Colorado and Australia and identifying storm damage after Typhoon Haiyan/Yolanda in the Philippines to name a few.

TC141: Mapping for International Development

Taking the online course, Mapping for International Development, allowed me to combine my interests in ICT4D, international development, data visualization, and a love of maps. I very much enjoyed the format of TC141 with the combination of live presentations, weekly readings and videos, exercises, discussion forums, and the step-by-step instructions and “how-to” materials. Although I tried to “attend” each live presentation the fact that everything was archived for viewing at my convenience was a real plus. This being my first online course, I was surprised at the level of personal interaction available between participants as well as with the facilitator. Chris Neu was a great facilitator: always enthusiastic, arranged interesting presenters and shared an immense amount of information with course participants. I had no specific goals for the course at the outset other than to broaden my knowledge of available mapping technologies. I quickly realized TC141 provided me a chance to gain a capability to work with GIS, a long-term interest of mine. As a result, I selected QGIS, the open source GIS platform as the primary platform upon which to develop my course project.

Mapping with QGIS and MapBox’s TileMill
In a preliminary course exercise we were introduced to MapBox/TileMill. In a follow-up exercise I used MapBox/TileMill to create a simple map of the top ten world coastal cities at risk from flooding due to climate change – including Dhaka, Bangladesh. Given that we have a family friend from Bangladesh, I felt a more detailed investigation of flooding patterns in Bangladesh, an increasingly frequent problem, might lend itself to my major project for the course.

Drawing upon existing sources of information available via the Internet, I located shapefiles for administrative districts, the extent previous flooding, road systems, airport and hospital locations, topographic information, population data and more. After importing this information into QGIS I was able to identify recently flooded and flood prone areas of the country. Seeing how flooding can compartmentalize the country and disrupt the movement of people and relief supplies between areas, I then performed a quick search of key medical facilities and major airports to better understand which would be affected and which might be available to support relief efforts. The QGIS-based flood map was then exported into MapBox/TileMill where it was further refined using the tools and capabilities within the MapBox platform.

Mapping Bangladesh’s Flood-Prone Zones
Given that our Bangladeshi friend is engaged in development activities in the Khulna administrative district, I wanted to see whether flooding in Khulna might impact their area. Based on Internet research, I chose flooding from a 6-meter storm surge as the basis to work from. I then located ground elevation data for Bangladesh and loaded the file into QGIS. By filtering the elevation data I was able to “see” the general extent of flooding that might be expected in Khulna District by a 6-meter storm surge. I was very pleased with the resulting maps and the new skills and capabilities that I had gained. Prior to taking TC141, I was not even aware of QGIS or MapBox/TileMill. I feel compelled to note that my “flood maps” were solely academic mapping exercises and should not be interpreted to be definitive maps of anticipated flooding in Bangladesh. However, it did show me the new capabilities I had developed as a result of TC141.

Mapping in My Future
TC141 offered much more information than I have touched upon here. One area of discussion in the course was OpenStreetMap and Humanitarian OpenStreetMap. With my past involvement with crisis mapping I have developed an interest in pre-disaster planning. Although post-disaster efforts often involve hasty mapping after an event I am interested in what types of information and infrastructure could and should be mapped in advance of disasters as part of a preparedness program. For example, if we believe that climate change is expected to result in an increased frequency and intensity of tropical storms, typhoons, hurricanes, cyclones, etc. shouldn’t first responders and aid agencies have reliable maps to work with prior to a disaster? The Philippines experience, on average, 20 tropical storms per year. Accurate up-to-date maps of facilities and infrastructure needed to recover from such emergencies post-disaster should be mapped in advance in OpenStreetMap as part of a preparedness program. I am interested in learning more about the types of facilities and infrastructure that need to be mapped in advance as part of a preparedness effort and see OpenStreetMap as a logical platform for presenting that information.

Interested in learning how to build your own digital maps using the tools that Bob learned? Enroll now in our 4-week digital mapping course, Mapping for International Development.

By Lauren Bailey, TC309: mHealth – Mobile Phones for Public Health alumna

Lauren Bailey

My final project for TechChange’s mHealth online course overlapped a final project for a master level global environmental health course. I’m currently working towards a Master of Public Health degree, concentrating in global environmental health, and specifically focusing in water, sanitation, and hygiene (WASH). I recently became interested in mHealth and decided to do my global environmental health course project on mHealth in the WASH sector. Since I was new to mHealth, I kept the project simple, touching on some basics. This background document includes: (1) applications of mHealth in WASH; (2) case studies; and (3) recommendations.

Throughout TC309, I became increasingly interested in how mHealth can be applied to behavior change, a major component of reducing WASH-related illness. The mHealth online course has been a wonderful way to learn about the different applications of mHealth, the challenges and successes of programs, and the future possibilities of mHealth. I’ve been inspired by many of the articles, discussions, and live presentations and am now incorporating mHealth into my master’s thesis.

Here is the infographic I created, using Piktochart as part of my course project:

mHealth-in-WASH-infographic_Lauren Bailey

Highlights:

  1. Mobile phones offer a means to reach most at-risk populations, particularly those in rural areas, to change health outcomes.
  2. More individuals in most African countries will have access to a mobile phone than they will to an improved water source by 2013.
  3. Mobile phones have been deployed over the past decade as tools to improve water, sanitation, and hygiene.
  4. Client education and behavior change communication, data collection and reporting, financial transactions and incentives, and supply chain management are potential mHealth applications categories.

To read Lauren’s entire final project from the online course, mHealth: Mobile Phones for Public Health, please click here.

Interested in learning more about how mobile phones are impacting WASH, healthcare, and promoting health worldwide? Register now for our 4-week online on mHealth here.