Data is useless unless it provides us with actionable insights into our work. In order to make sense of the data, however, we need to understand it, which is why data visualization is so important. Technology has made it easier to translate data into understandable and aesthetically pleasing visualizations, but with so many options out there, it can be hard to know where to begin and how to properly take advantage of and utilize those options. That is why we offered our first course on Technology for Data Visualization in June.

95 participants from 19 countries joined us for the four-week online course. We take a look at some of the highlights from the course:

Exposure to data viz tech tools and enthusiasts: Our participants were introduced to more than a dozen different types of data visualization dissemination formats in the course. They shared the context of their work and data visualization needs with each other. Through discussions on the platform with their fellow peers as well as our facilitators, the participants were able to decide which tool was the most appropriate for them in order to create the most logical aesthetical presentations for the data and audience at hand.

Access to data visualization experts: The course facilitators, Norman Shamas and Ann K. Emery arranged for a great line-up of guest experts. Guest experts included Tony Fujs of the Latin American Youth Center, Noah Illinsky of Amazon Web Services, Brittany Fong, and others. With access to a great panel of speakers, the participants were able to ask questions and interact with them during our live events as well as connect with them outside of the course. The guest expert sessions also exposed students to new methods of presenting data that would change the way they conceptualized the ability to create and display visual analytics.

Beautiful data visualizations: Our participants complete our courses with a final project and it’s always a great way to see what they learned from our course. Some course participants used data visualizations to complement a report on community feedback related to the humanitarian response after the Nepal earthquakes in April. Another participant created a visual report to summarize the performance of her company’s project in Haiti for the past two years. One participant also achieved her goal of mapping the Washington, DC Craft Brewery density!

Each individual chose a different software and adapted it to their specific needs and target audience, illustrating our participants’ access to a wide range of tools, as well as their grasp of the process of deciding when one tool/dissemination format is more appropriate than another. Keep an eye on our blog for when we feature some of our participant’s final projects!

Here is what some of the participants had to say:

Christina Gorga

“It’s a superb introduction to all things data visualization with a focus on getting the most out of your data to create a specific story. It’s not just about creating pretty things, but rather focusing on the best methods to visualize the results in an effective manner.” – Christina Gorga, Westat

Joseph Sylvain

“You don’t need to be an expert in statistics or in IT to be able to understand what is taught. I learnt a lot in a very short time and I feel now empowered to better do my job as M&E advisor. I’m now able to better visualize/present data to my supervisors to help them make evidence-based decisions.” – Joseph Sylvain Kouakou, Centers for Diseases Control and Prevention (CDC) Cote d’Ivoire

We are offering the second iteration of the course again! The course will run from November 23 to December 18, 2015. Over 110 students from 27 countries have already enrolled representing organizations like DAI, FHI360, The Red Cross, IOM, John Hopkins University, University of Florida, University of Colorado School of Medicine, USAID, World Bank Group, World Vision and more!

Come join our growing online community for a chance to meet and learn with fellow peers from around the world who are passionate about technology for data visualization. The course begins on November 23, so register now to secure your spot!

Featured image: Nic McPhee Flickr (Creative Commons License) 

Over the years, TechChange has provided several professionals in the international development community with the crucial tech skills needed to make an impact in their work. Oftentimes, learning tech skills means first learning a software as basic as Microsoft Excel. We have all worked with Excel, but few of us really know its power to meet a wide range of data analysis and visualization needs. To fill this gap, we’ve created an interactive TechChange course for those who want to harness the power of Excel for Data Visualization.

Why Excel?
Today, Excel is still a critical digital skill sought for office and administrative positions, among others. Many companies still use Excel to manage their finances and human resources. According to a new report by Burning Glass Technologies and Capital One, knowing Excel can lead to a better paying job: 67% of middle-skill jobs demand these digital skills, and positions requiring these skills tend to pay 13% more than jobs that don’t.

In our Tech for Data Visualization course, participants were introduced to new software and tools to better visualize data, but many were also curious about how to use Microsoft Excel to do even more. Because of this, we decided to make a self-paced course that could be completed at any time and could you get these crucial skills in under two hours.

Intro to Excel for Data Visualization

In this course, you will learn the nuts and bolts of how to use Excel functions and features like INDEX MATCH, PivotTables, Slicers, and more.You will also learn key data visualization principles that will help you optimize your data visualizations to best communicate your data.

We spent six weeks creating this interactive course and we’re excited to make it available for you! You can take the course in your own time, and if you have around an hour and a half, you can complete the course in one go.

Along with going over some important Excel functions like VLookup, basic macros, pivot tables, slicers, to create both static and interactive visualizations, the course includes case studies of how two different organizations used Excel for their data visualization needs. You will see how D3 systems used Excel to visualize public opinion data in Iraq, and how JSI used Excel to create a dashboard for global contraceptive security indicators. By interacting with real-world examples, you will be able to see the potential Excel has in your own work.

If you’re interested in learning more, check out the course details here and join the growing learning community at TechChange!

One of the things that sets the TechChange platform apart from other online courses is the network you are immersed in. Today, we are excited to highlight one of our alumna who took the network she built within one of our courses, into the incredible work she’s doing. Devjani joined us in our Technology for Monitoring and Evaluation course a few months ago, and her curiosity for the role of technology in M&E led her to take a deep dive in one of the tools she was introduced to in the course. We got to catch up with her on how the course has influenced her work.

How did you come across our Tech for M&E course?

I was on a year-long sabbatical in London from the National Hydroelectric Power Corporation (NHPC) in India. During my sabbatical, I wanted to learn more about the role of technology in monitoring and evaluation. I was looking for a course that would not only provide me a sound knowledge of the system but would also be cost-effective for me. So, after a few google searches, I came across TechChange’s course on Technology for Monitoring and Evaluation and immediately signed up!

Why were you curious about the role of tech in M&E?

NHPC’s power projects are located in far-flung villages, from Jammu and Kashmir in the North to Arunachal Pradesh and Manipur in the North-East. The project locations are very remote without any infrastructure, roads, or communication, making survey, investigation and project completion very challenging. Due to the remoteness of these projects, we have often noticed that the socio-economic surveys were not being conducted very diligently. We have often found that there are lot of discrepancies and inaccurate data collected on project-affected families during Social Impact Assessment Studies. Manual data collection in these remote villages has been cumbersome, and the staff have to carry GPS, cameras and papers into the field. Sometimes, the affected villages are so far out that it takes more than a day to reach it by foot, and in that case, the data collected in paper surveys are re-entered manually into Excel sheets, leading to a high margin of error.

After the manual collection of data, the monitoring is done through site visits (once or twice a year) and the data collected by external consultants doesn’t always reach the NHPC, making it difficult to have baseline information on the families affected by the project.

I knew there had to be a better way to collect data and do M&E!

How did TechChange provide you with the information you needed to make an impact?

In the TechChange course, I was introduced to so many possibilities of ICT in M&E, but I was hungry for more and wanted to take an even deeper dive. From the various M&E tools I got to know through the TechChange course, I was interested in learning more about a data collection tool, Akvo FLOW. I had attended a guest expert session with Marten Schoonman of Akvo, so I reached out to the course facilitator to help me get in touch with him. Marten put me in touch with the Akvo India group and I was able to attend a five-day training session in India with the Akvo team to learn all about the tool and how well I can use it in my organization.

IMG-20151016-WA0014

Picture from the Akvo FLOW training in India

I attended a 5-day training, organised by the India chapter of the Akvo group with 40 other attendees. Everyone came from diverse backgrounds; some were tech savvy and highly educated while others were handling smartphones for the first time. It was a great opportunity for me to really dive into one specific tool that I was curious about.

Tell us more about Akvo FLOW

Akvo FLOW is a data collection platform that is used on inexpensive mobile phones with an Android platform. It has helped me with all of the following:

  • Getting the GPS coordinates
  • Obtaining authentic data from inaccessible respondents
  • Surveying a greater geographical area at lower costs
  • Ease of obtaining data on the dashboard
  • Using it in areas where there is no mobile network
  • Managing a database of respondents who can provide loads of data that can be used for baseline studies and longitudinal impact assessments
  • Geo-mapping of sampled areas and use of media such as pictures, audio and video,
  • Creation of identity cards
  • Data analysis and evaluation

Since NHPC’s projects are located in remote areas all over India, we can use Akvo FLOW to collect data from all projects in a standardised format and have it all in the same platform.

Any advice for someone considering a TechChange course to break into the ICT4D field?

Today, ICT has become an indispensable tool to bridge distances and spread the seeds of development in the remotest corners of this world. For funders and development workers, monitoring in remote areas is a daunting task, but the expansion of ICT has now paved the path towards limitless possibilities, providing easy access to information to make informed decisions. ICT4D is not just about computers, mobile phones and the internet, but it is also about help, support and capacity building of people who are using them and linking them with the right communities.

Here are five reasons I would always recommend TechChange courses:

  1. Extremely helpful and cooperative course coordinators. I was totally new to ICT when I enrolled for this programme, so I was prepared to feel lost. But with the help of facilitators and guest experts, I could get hands-on experience with the Akvo FLOW tool. This has opened a new door of opportunity for me and I am excited to implement what I learned to my work.
  2. Course material is beyond just PowerPoints. It’s very interactive with plenty of networking opportunities, group discussions and presentations, live question and answer sessions, feedback from other participants, video chats, etc. making the whole learning process very engaging and enjoyable. There is plenty of learning opportunities from course participants as well, who are very experienced and coming from different parts of the world with different sets of skills and approaches.
  3. Courses are very well crafted and exhaustive yet comprehensive. Excellent study materials that are up to date.
  4. Connecting with guest experts who are leaders in the ICT4D industry. It’s very difficult to get access to such a range of good study materials and get to hear from the experts themselves.
  5. Courses are easily accessible. All the course material, even live events are recorded and archived for those who could not attend the live sessions. Then, the course materials are available even 4 months after a course ends, which gave me ample time to catch up and get a grasp of the whole syllabus.

What’s next?

It is going to be a daunting task to introduce ICTs in our public sector, but I am going to take up brainstorming sessions with senior officers from various organisations and try to understand how to effectively use these tools in our crucial surveys and monitoring of community development and CSR programmes and also use the same for conducting Social Impact Assessment studies.

“Nothing stops an organization faster than people who believe that the way they worked yesterday is the best way to work tomorrow. To succeed, not only do your people have to change the way they act, they have got to change the way they think about the past.” – Former Chairman of KPMG International, Jon Madonna.

So my journey begins here. I know it’s an uphill task to convince the system to accept this Akvo FLOW tool, which opens a whole new world of data transparency and authenticity, and successfully integrating the tool in our various development programmes.

I would really like to thank the whole TechChange Team for giving me this opportunity to share my views and experience with you all. I am going to come back to them over and over for many more courses that would not only ensure progress in my professional development but also give me inspiration and satisfaction to work successfully in the field of social development.

***
Interested in learning more about data collection, you can still join our Tech for Data Collection and Survey Design course that started on Monday! Want a more immersive experience? Check out our Tech for M&E Diploma program!

About Devjani
Devjani
Devjani has been working for over 18 years in India with a successful track record in the area of Environment, Social Development, CSR and Sustainability. Her experience extends across large hydro and mining projects within the government & NGO sectors and international funding agencies. She has travelled extensively in India to conduct a range of investigative studies. Devjani is a Registered PRINCE2 Practitioner and has a postgraduate degree in Public Systems Management with specialisation in Environment. She has also done a Post Graduate Certificate course in Environmental Impact & Assessment with specialisation in Strategic Environment Assessment.

Featured image: Isha Parihar from Akvo India trying to calibrate the GPS in the field

We are excited to welcome Heba Ghannam, a PFP Fellow (Professional Fellows Program) from Egypt! The Professional Fellows Program is a US state department fellowship organised by Legacy International, that brings emerging leaders from the public and private sector from around the world to the United States for an intensive five-week fellowship, designed to broaden their professional expertise. This year, TechChange is excited to host Heba!

Heba is an Egyptian social activist with a strong passion for democracy, human rights, development and social change. After earning her Bachelors degree in political science from Cairo University, Heba worked for Procter & Gamble for four years, travelling between Egypt, Lebanon, Jordan and Syria while doing lots of development work with local NGOs as a volunteer. After the January 25 Revolution, Heba quit her job to join the first Middle-Eastern incubator for social enterprises. She then joined “Tahrir Academy”, a non-profit online collaborative learning platform replicating the Khan Academy model for Arabic speaking countries. She currently works for UNICEF Egypt where her work focuses on adolescent development and gender. In her spare time, Heba loves reading, especially about anthropology, Sufism, and history.

Heba will be at TechChange as for her PFP fellowship for 5 weeks. Welcome Heba!

The Global Goals for Sustainable Development, a to-do list for humanity, were approved just over a week ago in New York City. Anyone working in this field is riding a collective high and those directly involved with the drafting of the Global Goals for Sustainable Development have breathed a sigh of relief. But the adoption of the Global Goals mark just the beginning of a long road to hitting the 169 targets approved by 193 countries.

Here are four steps you can take if you want to play your part in tackling the Global Goals:

1. Find your passion

A lot is going on in the 17 Global Goals — from ending world hunger to achieving gender equality, this wasn’t a plan crafted for the faint at heart. Check out the goals here and lay your claim on the one that most aligns with your passion and curiosity.

2. Evaluate your skills and resources

What are you good at? This can be so-called hard skills, like web development, social media or writing, but think bigger than that. Are you a good public speaker? Can you cook? Do you have access to a car? Can you speak a second language? A flexible work schedule?

There are a plethora of resources and skills we all possess. Organizations are looking for volunteers to do everything from mentoring a refugee on how to enter the job market to setting up tables for a gala. A lot of small every day tasks go into making a huge impact.

3. Find organizations that inspire you

There are tens of thousands of organizations tackling issues covered in the Global Goals, and each one has a unique perspective and solution to offer. From faith-based organizations to Fortune 500 philanthropies, there’s something for everyone. Now that you know what skills and resources you’d like to use, you should have a clear idea of whether you’d like to support an organization virtually, locally or globally. Start a Google search that combines your interests and your skill sets, then use a site like Charity Navigator to investigate their efficacy and overall standing in the non-profit world.

4. Connect and be relentless

Hooray! You’ve found the sweet spot where your passions and skills intersect with an organization doing work you care about. Now is the time to reach out and offer up your services. Larger organizations tend to have a regimented process for on-boarding volunteers, and many require a certain level of commitment over a period of time. Smaller, local organizations can be more flexible. Whichever route you go, ensure you’re committed and ready to contribute in a meaningful way.

The Global Goals cannot be achieved without deep collaboration. It’s important to remember that there is no one organization with the solution to today’s biggest crises. And we must remember that nothing exists in a silo — we will need to work across sectors and borders if we are to come even close to seeing a world with no poverty, no hunger, no injustice.

Are you in? Share the ways you want to get involved in the comments below.

Jennie is the Director of Marketing at TechChange and is a 2015 Social Good Summit UNA Blogger Fellow.

A version of this post was published by the UNA Blog.
Featured image credit: DFID Flickr

Last month, for the first time we launched a whole diploma program in technology for monitoring and evaluation. We started this program to give our community a learning experience that lasts more than a 4-week course, and to offer a quality learning experience without breaking the bank. We were excited to launch this new program and were excited to see our community’s response.


Today, we are happy to announce that we have over 90 participants enrolled in our pilot program! And they are joining us from 30 different countries, like the U.S., Bolivia, Ethiopia, India, Jordan, Kenya, Netherlands, Canada and more. This week, we are wrapping up the first course in the diploma program, Technology for Monitoring and Evaluation that ends with a workshop.

The next course in our diploma program is Technology for Data Collection and Survey Design that begins on October 19, where we will explore new tech tools, and learn how to design and deploy digital surveys, and how to combine active and passive data collection.

If you are interested in joining the diploma program for the second intake, you can sign up today!

In August, along with announcing our Tech for M&E Diploma program, we kicked off a M&E Professionals Series, where we will be talking one-on-one with M&E professionals to give you the inside scoop on the industry.

For this second post in the series, we are featuring an interview that one of our alumni, Stephen Giddings conducted, with Janet Kerley, Senior Director, Monitoring and Evaluation Practice at Development and Training Services, Inc (dTS), a Virginia-based consulting organization that does considerable work with USAID.

Janet Kerley
Janet Kerley is a master evaluator and an accomplished trainer in evaluation and performance measurement. As Senior Evaluator in the Monitoring and Evaluation Practice at dTS/Palladium, she provides technical leadership for evaluations in the ME unit, provides technical direction on design and field methods, and supervises the preparation of the evaluation reports. As Chief of Evaluation, Research and Measurement for the Peace Corps, she established an impact evaluation system at Peace Corps.

Ms. Kerley was the Team Leader for Monitoring and Evaluation in the Office of the Director of Foreign Assistance, US Department of State, leading a 200-member inter-agency team to develop standard indicators for the 2007 Foreign Assistance Reform reporting tool. She worked at USAID in the Bureau for Policy and Program Coordination, CDIE and as the Monitoring and Evaluation Office in the Bureau for Africa and the Bureau for Europe and Eurasia. Prior to joining USAID, Ms. Kerley was a Senior Research Associate at Aguirre International. She has lived and worked in many countries in Latin America, Africa

S: How has technology changed the way M & E is conducted over the past decade in international development?
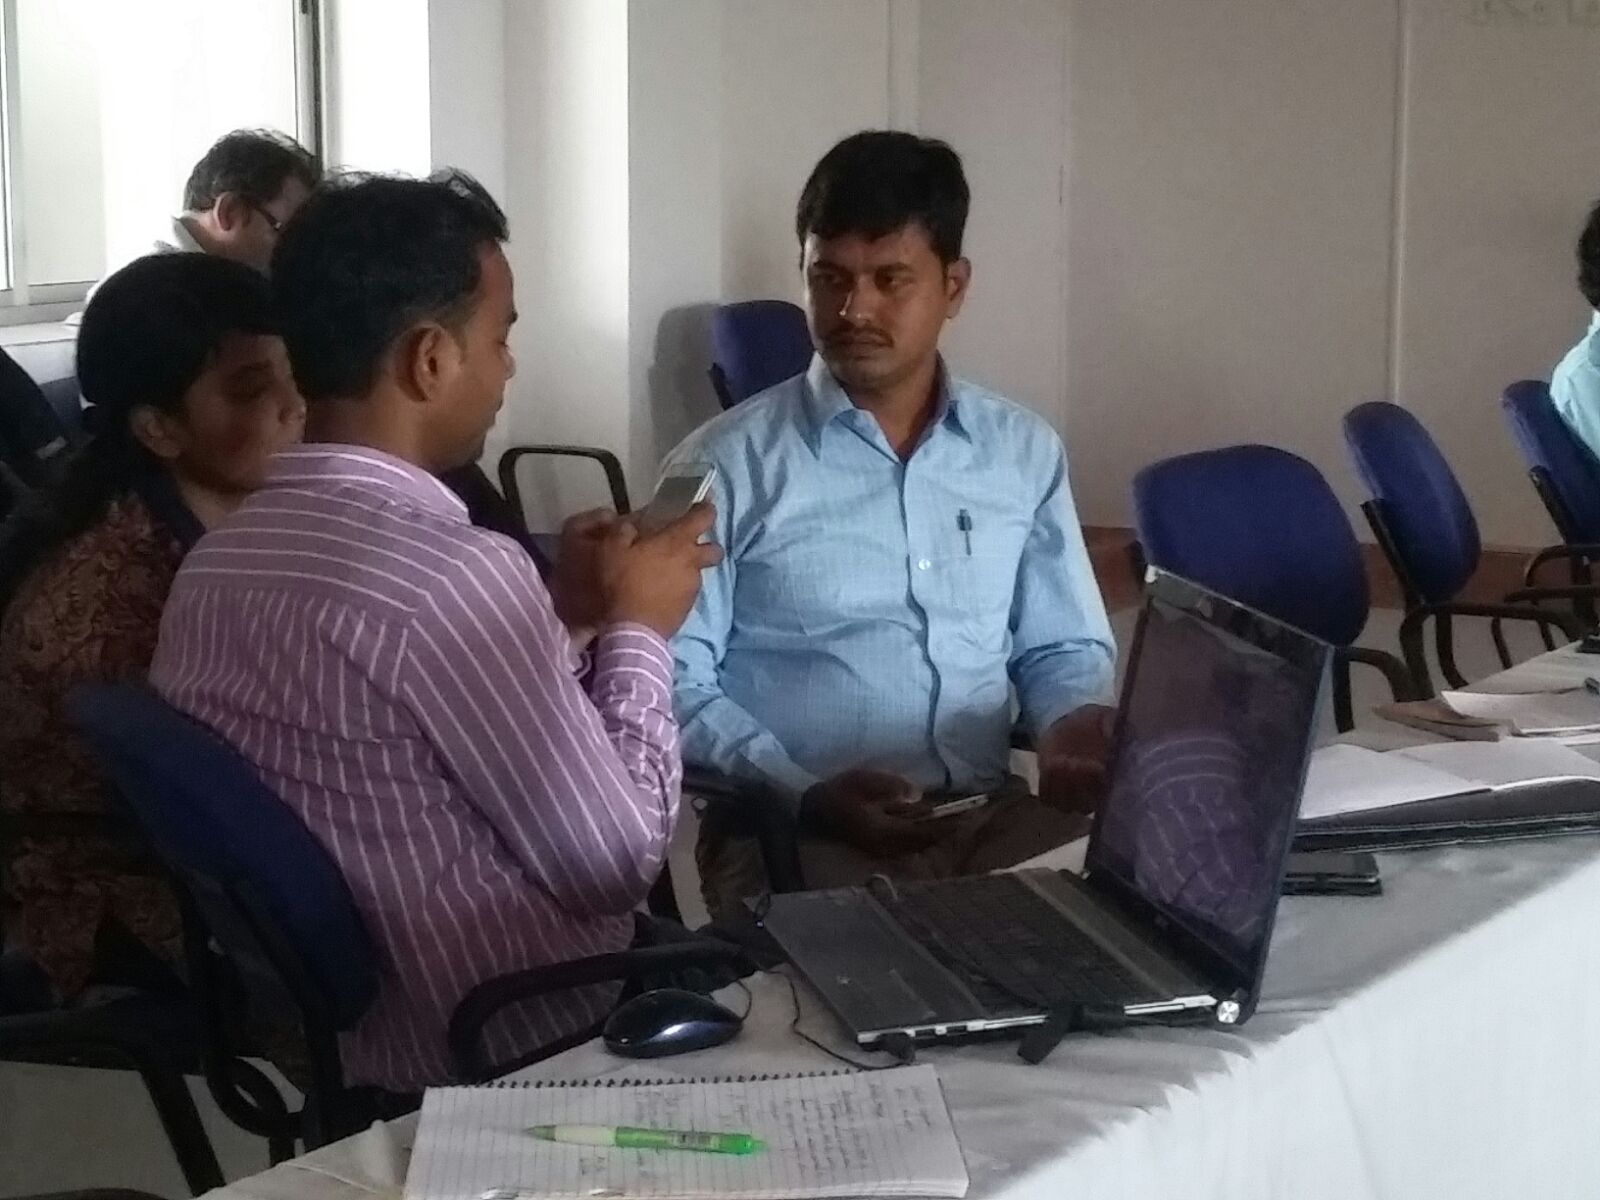
J: The change has been remarkable! A decade ago, most of the data gathering and analysis work was all paper-based, making it difficult, time-consuming, and costly. Especially in overseas environments, it took considerable time and effort to gather, transcribe (and often translate) and analyze the data. But today, the tech tools have made data collection and analysis more efficient and save time and money.
However, there is still a considerable “digital divide” between the much more tech savvy young people and the older professionals originally trained using SPSS (or even earlier)
technologies.

S: Does paper-based data collection still have a place in M&E today?
J: Yes — in certain circumstances paper-based data collection may be preferred.

In very rural areas where electricity may not be available, where batteries for electronic devices cannot be charged or where internet connections or mobile phone services is inconsistent or not available, paper-based data collection is still the best option.

Not everyone is comfortable with data collection using electronic devices, but they may be more open to paper-based questions.

S: What are some of the pitfalls of some of the popular tech-based data collection tools?
J: With so much tech available, it is easy to get carried away.

Some less experienced or less than fully trained data gatherers may lose sight of the fundamental questions the monitoring or evaluation is trying to get at. If evaluators lack sufficient training in sound principles of research, they may be tempted to substitute technology for sound reasoning and good judgment.

Some data collection tech tools may also have a tendency to collect too much data, some of which may be irrelevant to the task at hand. USAID, in particular, is burdened by data overload where data management systems fail to filter out data that is of little use and complicates the monitoring and evaluation practices.

S: What challenges have USAID Missions faced when integrating new technologies into their M& E functions?
J: By and large, USAID Missions have been quite open to technological improvements to M&E functions. That said, there is still a “digital divide” where younger employees (including local staff) who have grown up in the digital age are more comfortable with and more adept at using new technologies to enhance M & E. But more senior and older USAID staff seem generally open to embracing and appreciating the advantages that new technologies can bring to M & E while leaving the technical analysis and the new data gathering tools to younger techie staff. USAID staff have generally been very receptive to training in using new M & E technologies to their advantage.

S: Have new evidenced based technologies made decision making by senior USAID staff easier and more informed?
J: Most USAID Mission Directors recognize the value that good evidence on performance can bring to the achievement of program results, and the added clarity that good data and visually well-presented documentation can bring to decision making.

UNDP in Kigali, Rwanda (Creative Commons image)
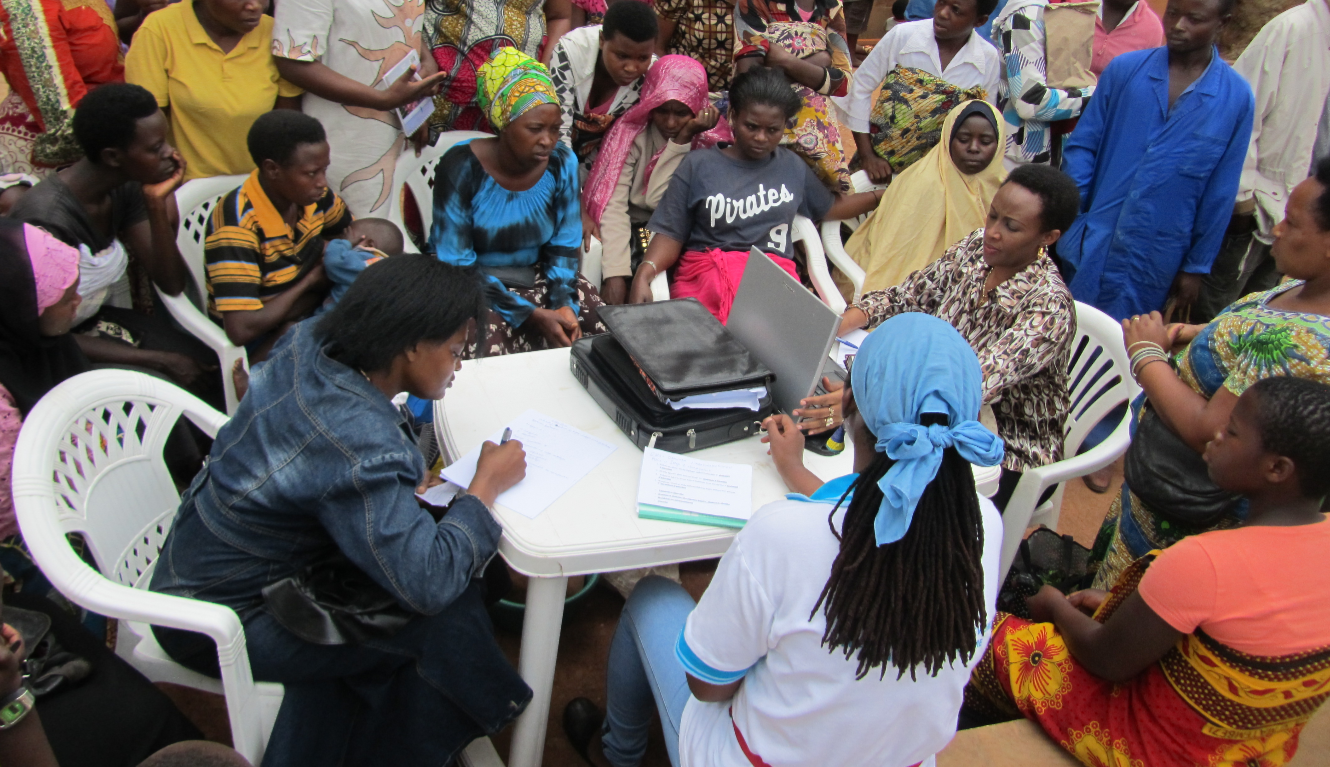
Photo Source: UNDP in Kigali, Rwanda

S: What are the advantages of mixed methods evaluations?
J: The most important starting point for an evaluation is doing the research required to understand what questions you want answered. Only then should you begin to look at evaluation methodologies to acquire necessary information.

When done at a proper scale, well executed quantitative data collection and analytical methods can bring statistical rigor and clarity. For example, the scale of some of the evaluations done for USAID’s food security (Feed the Future) programs has generally provided reliable data. Unfortunately, USAID Missions sometimes do not make available sufficient budget to assure that sample size for quantitative methods is sufficient to draw reliable conclusions. This is where qualitative methods can help to fill gaps.

Storytelling, an evaluation tool, is one of the most useful qualitative data collection methods. Sometimes quantitative data collection methods do not allow beneficiaries to open up and provide adequate and reliable information, but they react much more positively if they are allowed to tell a story. If you get enough good stories they can provide insights and nuances that purely quantitative methods cannot. Thus mixed method evaluations can provide more reliable evidence of performance than quantitative or qualitative methods.

S: Do you think there is a bias towards quantitative methods in international development because of a lack of free and easy to use qualitative tools?
J: Not at all. Many USAID evaluations make good use of qualitative methodologies. A
decade ago, there was an overuse of “the windshield wiper” approach (an evaluation that is not given time to do adequate field work and they report what they observe “through the windshield.”) to evaluations but more recently qualitative methodologies have become more sophisticated and reliable and can provide a lot of extremely useful information for decision makers.

S: What questions should we be asking to select the best technology for M & E?
J: Evaluation planning should begin with framing the research questions — what is it that we need to learn? The preferred technological solution should be one that can best answer the research questions and must also take into account cultural sensibilities. It is very crucial that technology be viewed as a tool, and not as a substitute, for knowing the basic principles of research.

StephenIDphoto
Stephen Giddings, a TechChange alum, has served for 25 years as a Foreign Service Officer with the USAID, retiring in late 2005. For most of his USAID career, he specialized in managing housing and urban development programs, serving in USAID offices in Panama, Kenya, Cote d’Ivoire, Russia and Rwanda, as well as Washington, D.C. During his last four years with USAID he was the Chief of the Policy Division for USAID’s Africa Bureau.

For the past ten years Mr. Giddings has been an independent consultant providing assistance to the Development Assistance Committee (DAC) of the OECD, and consulted with USAID, the International Real Property Foundation (IRPF), among other international development organizations. He serves on the Development Issues Committee of the USAID Alumni Association and is Co-Chair of the Africa Work Group in the Society for International Development’s Washington, D.C. Chapter (SID-Washington). Prior to his USAID career, Mr. Giddings managed low-income housing development programs at the U.S. Department of Housing and Urban Development and was Director of Planning and Development at the Boston Housing Authority. Mr. Giddings received a BA in political science from Wesleyan University and an MPA degree from the Maxwell School of Citizenship and Public Affairs at Syracuse University.

——-

Hope you enjoyed our second installment of our M&E Professionals Series! Don’t forget to follow our blog for the next post in the series!

Interested in engaging in similar conversations with M&E professionals like Stephen and Janet? Join us in our upcoming course TC211: Technology for Data Collection and Survey Design that starts on October 19. If you want the whole package, you can join our second session of our Tech for M&E Diploma program

This article was originally published on Stanford Social Innovation Review. 

By Nick Martin & Christopher Neu

On November 3, 1961, John F. Kennedy’s universal call to fight poverty was formalized in the creation of the US Agency for International Development (USAID). Today, the rising cost of education means only a select few can answer that call. At USAID and implementing organizations, higher levels of leadership are mostly closed to those with only a bachelor’s degree. An elite master’s degree is especially costly—a two-year master’s in public policy from Harvard’s Kennedy School costs $154,688.

Students passionate about building a better future are increasingly being asked to mortgage their own in return. Students share the growing burden of student debt across the country: The median level of indebtedness for a Master of Arts degree jumped from $38,000 in 2004 to $59,000 in 2012, after adjusting for inflation. But the ability to repay debts is not equal across fields: Social workers are, in comparison, highly unlikely to make a salary sufficient to repay those debts without hardship. The result is that students are getting squeezed between inflated education requirements and constrained salaries at a time when the world most needs them to tackle complex global challenges.

To overcome the barriers of insufficient access to education, universities are turning to massive open online courses (MOOCs) to teach about sustainable development. For example, Wesleyan developed How to Change the World, Stanford created Mobile Health Without Borders, and even UC Berkeley has a new initiative to build a Philanthropy University with Acumen and NovoEd. But scaling a lecture hall through video content is easy; it’s creating an affordable and effective classroom experience that’s hard.

Further progress will require a revolution in online pedagogy as much as improved technology, or possibly even an unbundling of the graduate degree from the traditional 40 three-credit courses. As employers better identify the discrete skill sets and competencies they need, students will be empowered with clarity about where they want to spend their time and money to enter the workplace. Education and accreditation have never been more important for workplace success, but the in-person college experience may soon become an unaffordable luxury.

Digital Pedagogy post photo

Chris Neu and Norman Shamas facilitate a TechChange course in the TechChange studio

At TechChange, we believe that we can achieve a guided student experience, a network of dedicated alumni, and an expansion of career opportunities all online. Fortunately, our students believe the same. In the last month, we’ve seen record enrollments in our new low-cost online diploma program, with more than 120 applicants from more than 40 countries already signing up for our 16-week program on technology for monitoring and evaluation. These students come from organizations and governments such as UNICEF, Mercy Corps, Peru, and the World Bank. Employers have similar confidence in this model; several are sponsoring group enrollments in the diploma program.

Online educators have much to learn from one another. In building out the program, we have drawn heavily from in-person and online models of education that are pushing boundaries, including:

  • Amani Institute: Has a five-month post-graduate certificate program in applied skills for changing the world (now in Kenya and Brazil).
  • General Assembly: Known for its intensive, 12-week boot camps in computer programming and design, and has a great track record at placing graduates in better-paying jobs.
  • Khan Academy: Set the standard for engagement in online learning through quality content and personalized learning paths.

There is no clear answer to the problems of unsustainable careers in sustainable development. Universities are expensive, and these jobs are highly complex. However, by unbundling the graduate school experience, and examining how we can recreate and improve it online, educators might just find new methods for launching the next generation of development practitioners unburdened by lifelong debt.

Last week, the United Nations hosted the Sustainable Development Summit in New York and convened interactive dialogues on six themes including ending poverty and combating climate change. Perhaps it’s also worth discussing how we ensure that the careers of the people required to address these problems are also sustainable. Rethinking graduate school seems like a good place to start.

***

Nick (@ncmart) is the founder and CEO of TechChange. He is also an adjunct professor at Georgetown and George Washington Universities.

Chris (@neuguy) is the COO of TechChange. He holds a master’s in democracy and governance from Georgetown University.

This article was originally published on Stanford Social Innovation Review. Featured image credit: Russell Watkins, DFID Flickr.