On September 25 and 26, over 200 development practitioners and technologists filled FHI 360’s conference rooms and hallways in Washington D.C. to discuss the intersection between technology and monitoring and evaluation (M&E). Some of the conference attendees included participants and guest experts in TechChange’s ongoing online course on Tech for M&E and it was great meeting so many these online course participants in person and offline.

Supported by the Rockefeller Foundation, GSMA, and FHI 360, the M&E Tech Conference was a two-day conference held in D.C. (followed by another one event in New York) to discuss the emerging role of technology in M&E and its implications to everyone involved in the international development industry. The release of the discussion paper, Emerging Opportunities: Monitoring and Evaluation in a Tech-Enabled World kicked off the first panel, followed by two days of great panel discussions and engaging break-out sessions. The event also featured a panel facilitated by TechChange online course facilitatorKendra Keith on “What’s Next in Visualizing Data for Better Decision Making?” and a lightning talk on ‘How to Use APIs for Real-Time M&E’ that I presented.

In case you didn’t make it to the D.C. M&E Tech conference, here are a few key takeaways from the event.

1. Technology is not a substitute for good M&E methodologies

One of the panelists perfectly summed up the current state of technology in M&E from a technology perspective: it is not always clear why the M [monitoring] is associated with the E [evaluation]. While technology has made data collection and reporting easy, making sense of the data and how it affects programming still requires newer tools and M&E methodologies.

Good M&E requires capturing and analyzing both quantitative and qualitative data. While there are emerging M&E tools (e.g., SenseMaker) and techniques (e.g., natural language processing), cost and expertise continue to make capturing and analyzing qualitative data difficult. As mixed methods–using both qualitative and quantitative data — are discussed more in an M&E setting, practitioners still have a great deal of work to do.

Kerry Bruce speaks at the first panel

Kenneth M. Chomitz, Kerry Bruce (a guest speaker for TechChange’s Tech for M&E course), and Maliha Khan discuss the current state of Tech for M&E

Mobile phones have been a hot topic in development, but one of the lightning talks revealed a surprising fact: Mobile surveys are not as effective as we think they are. The average response rate for surveys conducted in-person was 77% compared to 1% for mobile phone surveys. While the comparison may not be fair, it is worth noting that the introduction of any technology also requires M&E.

2. Technology introduces new data issues to M&E regarding responsibility, security, and selectivity biases

During the first panel, one of the panelists mentioned that the next “scandal” in development will be about revealing sensitive data. While not a new topic in development, data responsibility becomes increasingly important with the introduction of technology. Unfortunately, data security was primarily relegated as a panel (Whose Data? Whose Privacy?) and a shout out as one of the 9 Principles for Digital Development. This panel also marked the release of the Responsible Development Data Guide, a resource I co-authored, that focuses on protecting digital data and beneficiary privacy in international development.

Linda Raftree and Michael Bamberger lead a break-out session

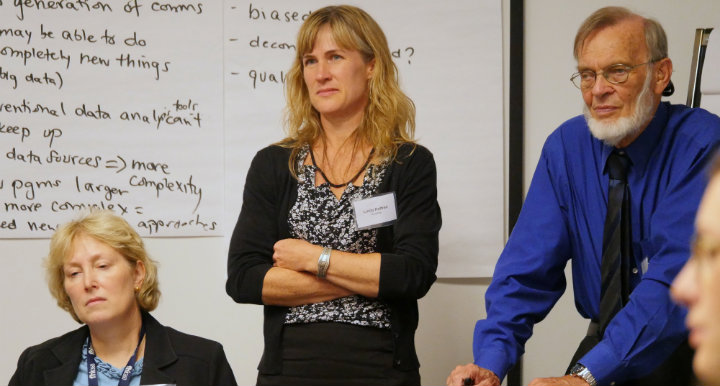
Linda Raftree (a regular TechChange guest expert) and Michael Bamberger lead a break-out session discussing the emerging opportunities and challenges of using ICTs for M&E

Another common problem that arises with introducing technology to M&E is selectivity bias. Digital surveys tend to be limited to digitally literate populations with access to technology. Yet, even digital literacy and access to technology doesn’t guarantee a truthful response. For example, the panel on data privacy shared that women often didn’t respond truthfully to mobile surveys because their husbands or family members often monitored their personal phones.

Technology also biases researchers and evaluators towards quantitative methods and data. Qualitative data collection, analysis, and visualization software has not kept pace with tools for quantitative data.

3. Data matters more than ever in development

Recognizing the challenges and opportunities technology brings to M&E, the event included many conversations on data. There were break-out sessions on topics like data visualization, leveraging big data, how mobile phones can help in M&E, data security issues, and more.

Data visualization

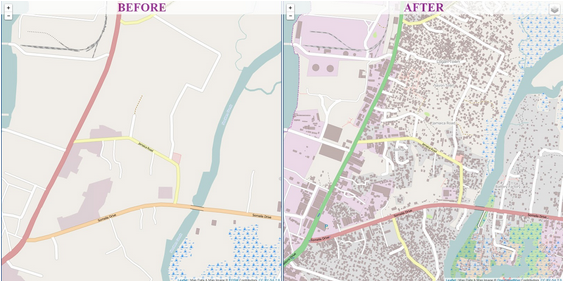
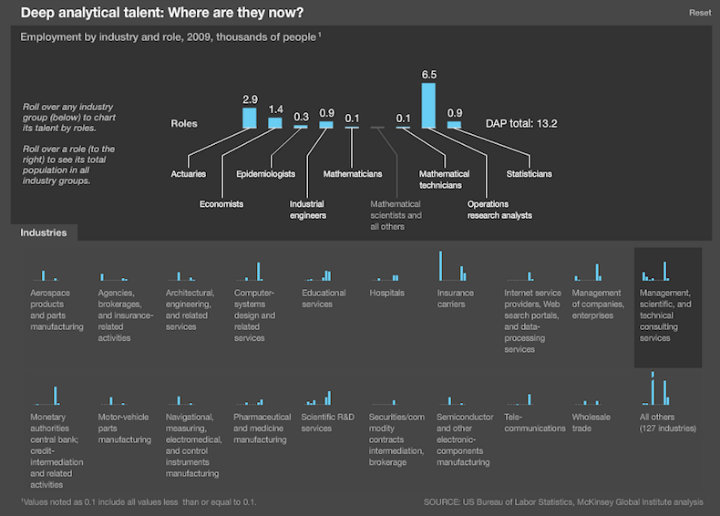
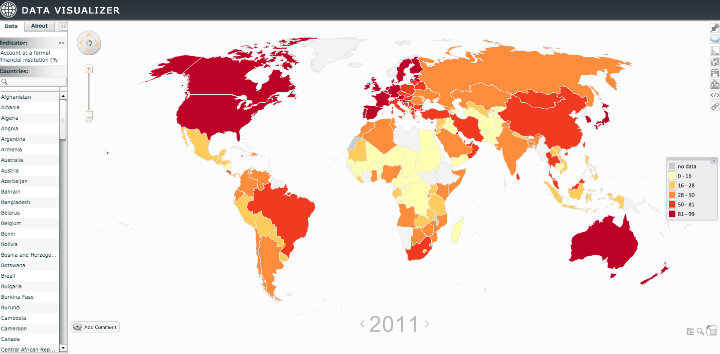
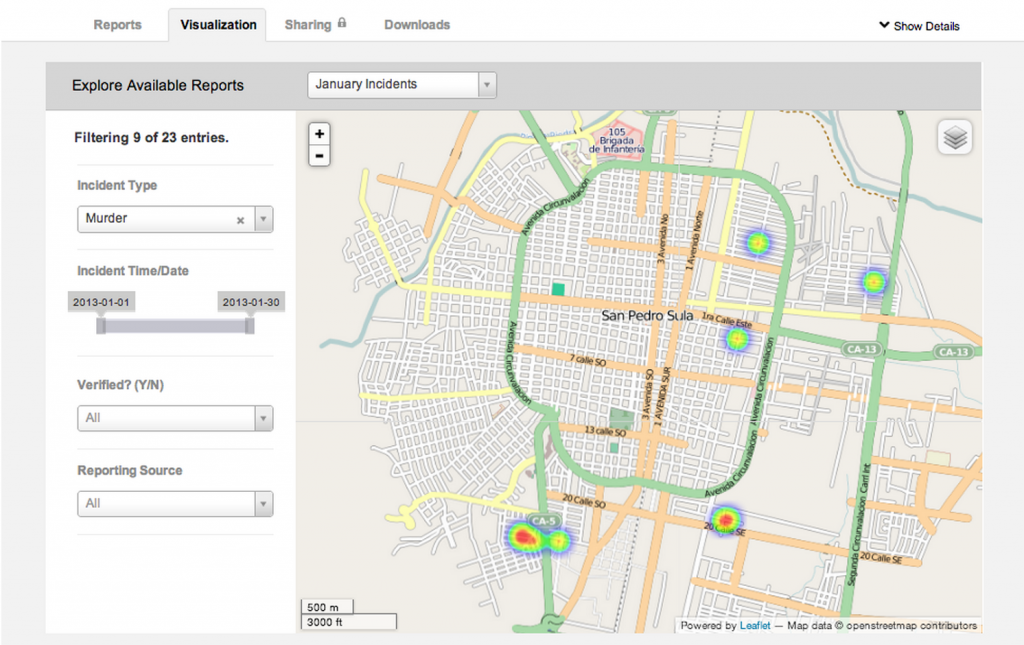
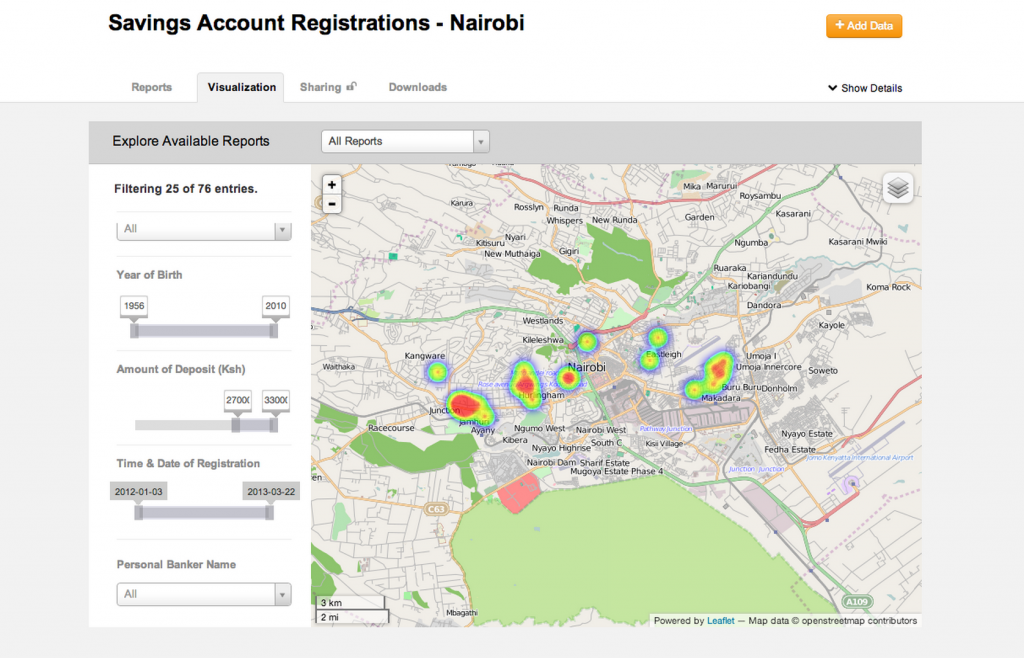
The data visualization panel showed that there are a lot of new techniques to visualize data. Network visualization is a fantastic way to view a system (e.g., an organization or a program). It’s a simpler way to see where multiple links connect and understand where they need to be strengthened. Mapping allows for easier analysis of aid efficacy. Development Gateway presented their Aid Management Platform with its mapping feature that is aimed at governments in countries with development programs. In particular, they highlighted the success in Malawi and their public facing site with an interactive map. Excel–the tool that most people have and use to create pie charts–can be used to create some outstanding visualizations.

Neal Lesh of Dimagi presents at a Lightning Talk

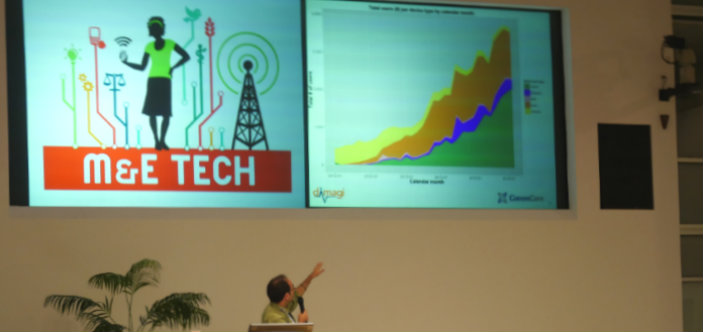
Neal Lesh of Dimagi presents trends in mHealth systems from over 175 CommCare projects

Open data

Most importantly, we are all looking forward to the day when open data is the standard. Many organizations spend a lot of time and money collecting the same data. If open data was the standard, available data can be used as baselines and potentially show impact after a project. Open data can also push for data structure standards (e.g., IATI) and allow data to be decentralized with application programming interfaces (APIs) connecting the data sources.

The challenges technology introduces to monitoring and evaluation, like data security and access, are topics we are also currently discussing in our Tech for M&E online course with a class of 100 students from all over the world. Due to popular demand, we are offering the next Tech for M&E course in January 2015.  If you are interested in joining the discussion, apply before November 1 to get $100 off the full price of the course during this early bird discount period for the next Tech for M&E course.

If you did attend the event, what did you take away from the conference? Did you attend the conference in New York? Share some of your highlights and insights!

By Timo Luege, TC103: Tech Tools and Skills for Emergency Management facilitator

As Ebola continues to ravage Sierra Leone, Guinea and Liberia, people from all around the world are working together to stop the disease. In addition to the life saving work of medical staff, logisticians and community organizers, information and communication technology (ICT) is also playing a vital part in supporting their work.

After consulting the TechChange Alumni community and other experts in international development and humanitarian assistance, I pulled together a list of different technologies being applied to manage Ebola. Below are six examples showing how ICT is already making a difference in the current crisis.

1. Tracing outbreaks with mapping and geolocation
Aside from isolating patients in a safe environment, one of the biggest challenges in the Ebola response is tracing all contacts that an infected person has been in touch with. While that is difficult enough in developed countries, imagine how much more difficult it is in countries where you don’t know the names of many of the villages. It’s not very helpful if someone tells you “I come from Bendou” if you don’t know how many villages with that name exist nor where they are. The Humanitarian OpenStreetMap Team has helped this process through creating maps since the beginning of the response.

See: West Africa Ebola Outbreak – Six months of sustained efforts by the OpenStreetMap community.

Monrovia OSM pre-Ebola
Map of Monrovia in OpenStreetMap before and after volunteers mapped the city in response to the Ebola crisis. (Humanitarian OpenStreetMap)

In addition, the Standby Task Force is supporting the response by helping to collect, clean and verify data about health facilities in the affected countries. The information will then be published on UN OCHA’s new platform for sharing of humanitarian data.

2. Gathering Ebola information with digital data collection forms
Contact tracing involves interviewing a lot of people and in most cases that means writing information down on paper which then has to be entered into a computer. That process is both slow and prone to errors. According to this Forbes article, US based Magpi, who just won a Kopernik award, is helping organizations working in the Ebola response to replace their paper forms with digital forms that enumerators can fill out using their phones.

Digital forms not only save time and prevent errors when transcribing information, well designed digital forms also contain simple error checking routines such as “you can’t be older than 100 years”.

If you are interested in digital forms, check out the free and open source Kobo Toolbox.

3. Connecting the sick with their relatives using local Wi-Fi networks
Elaine Burroughs, a Save the Children staff member who is also TechChange alumna of Mobiles for International Development, shared that they are using their local Wi-Fi network to connect patients in the isolation ward with the relatives through video calls. Both computers have to be within the same network because local internet connections are too slow. In situations where video calls are not possible, they provide patients with cheap mobile phones so that they can talk with their relatives that way. Elaine added: “Several survivors have told us that what kept them going was being able to speak with their family and not feel so isolated when surrounded by people in hazmat suits.”

4. Sharing and receiving Ebola information via SMS text messages
I have heard about a number of different SMS systems that are currently being set up. Some are mainly to share information, others also to receive information.

mHero is an SMS system specifically designed to share information with health workers. It works with UNICEF’s RapidPro system, a white label version of Kigali-based TextIt which is one of the best SMS communication systems I know. RapidPro is also at the heart of a two-way communication system that is currently being set up by UNICEF, Plan International, and the Scouts.

The IFRC is of course using TERA to share SMS, a system that was developed in Haiti after the 2010 earthquake and already used in Sierra Leone during a recent cholera outbreak.

5. Mythbusting for diaspora communities via social media
Social media also has a place, though not as much as some people think. With internet penetration at less than 5 per cent in Liberia and less than 2 per cent in Sierra Leone and Guinea, it is simply not relevant for most people – unlike radio for example. However, all of these countries have huge diasporas. The Liberian diaspora in the US alone is thought to be as many as 450,000 people strong – and they all have access to social media. Experiences from Haiti and the Philippines show that the diaspora is an important information channel for the people living in affected countries. Very often they assume that their relatives in the US or Europe will know more, not least because many don’t trust their own governments to tell the truth.
Social media can play an important role in correcting misinformation and indeed, both the WHO and the CDC are using their social media channels in this way.

6. Supporting translations of Ebola information remotely online
Last but not least, Translators Without Borders is helping NGOs remotely from all over the world to translate posters into local languages.

Low tech does it
As a final word, I’d like to add that while technology can make a real difference we must not forget that very often low tech solutions will be more efficient than high tech solutions – it depends on what is more appropriate for the context. So don’t start an SMS campaign or launch a drone just because you can. It’s not about what you want to do. It’s not about technology. It’s about what’s best for the people we are there to help.

A Summary Infographic

TechChange Ebola Infographic

We will be discussing these technology tools, Ebola, and many similar issues in TC103: Tech Tools and Skills for Emergency Management and TC103: mHealth – Mobiles for Public Health. Register by October 31 and save $50 off each of these courses.

Do you have additional examples of how ICT is helping in the Ebola response? Please share them in the comments!

This post originally appeared in Social Media for Good.

About the TC103 facilitator: Timo Luege

Timo Luege

After nearly ten years of working as a journalist (online, print and radio), Timo worked four years as a Senior Communications Officer for the International Federation of Red Cross and Red Crescent Societies (IFRC) in Geneva and Haiti. During this time he also launched the IFRC’s social media activities and wrote the IFRC social media staff guidelines. He then worked as Protection Delegate for International Committee of the Red Cross (ICRC) in Liberia before starting to work as a consultant. His clients include UN agencies and NGOs. Among other things, he wrote the UNICEF “Social Media in Emergency Guidelines” and contributed to UNOCHA’s “Humanitarianism in the Network Age”. Over the last year, Timo advised UNHCR- and IFRC-led Shelter Clusters in Myanmar, Mali and most recently the Philippines on Communication and Advocacy. He blogs at Social Media for Good and is the facilitator for the TechChange online course, “Tech Tools & Skills for Emergency Management“.

In the last decade, new technology has made advances in data storage and analysis to leverage the greater volume of data available. The digital universe made up of all the data we create and copy will only increase in the future. The International Data Corporation and EMC’s research says that the digital universe is doubling in size every two years and by 2020, will contain nearly as many digital bits as there are stars in the universe (reaching 44 trillion gigabytes).  We now live in a period of time defined by data: Data scientists are the new must hire position yet, McKinsey & Co.’s research says that by 2018, the U.S. will experience a shortage of 190,000 skilled data scientists.
McKinsey research on data scientists in different industriesWhat industries are the data scientists working in now

Government surveillance through internet data has been in the news since Edward Snowden’s leaks, and the popularity of sites such as FiveThirtyEight has popularized data journalism. International development donors have recognized this and are demanding more data from implementing partners and placing greater emphasis on monitoring and evaluation (M&E). While M&E is used to cover a wide variety of activities–from reporting to research–at its core, it is a way to ensure international aid programs are providing effective interventions.

Much like how the data revolution has sparked innovative software for the private sector through NoSQL data storage, software and technological innovation for M&E is beginning in international development. A reflection of conversations during Tech Salon’s M&E discussion show that M&E tend to be afterthoughts to program design because of fear of failure and the lack of funds. However, today technology and M&E are increasingly being requested in international development.

Here are a few reasons why we need to better integrate technology, M&E, and international development.

Greater Transparency

The US government has embraced the data revolution by providing open access to some of its data. This access provides not only greater transparency, but also greater scrutiny over spending and its efficacy. Anyone can easily see how much money the US government is spending on foreign assistance and engage in dialogue on whether the money is being spent properly and effectively. Initiatives such as the International Aid Transparency Initiative (IATI) work towards greater transparency across all donors and have established one standard for donors to report information on monetary flows in development.

Using technology-enabled M&E effectively will allow development implementers to prove program efficacy more quickly and easily. Programs can adapt activities on the basis of real time M&E, providing more benefit to beneficiaries. Global indicators can be used to show impact throughout multiple projects. Visualizations, such as maps, can present the wealth of data collected into an easily understood form.

World Bank Data Visualizer: Formal Financial InstitutionWorld Bank Data Visualizer world map

Proving impact and greater accountability helps USAID and other clients justify spending money on development programs to their stakeholders. In turn, the clients can keep funding programs and continue helping people throughout the world.

Data responsibility

Snowden’s revelations have brought the conversation of data responsibility and privacy to the general audience. For development practitioners, as donors request more and more data, we need to think about how to collect the data while protecting the beneficiary. It is important to consider what technology is appropriate for M&E as well as the metadata that it might reveal.

Utilizing technology-enabled M&E is more than including mobile phones into the process. It requires considering what data needs to be collected and whether it can do any harm to a beneficiary if the wrong person gains access to it. Technology and their limitations need to be understood to design data collection and any limitations for data analysis.

Put simply, technology is a tool for the M&E practitioner, not a solution on its own. The concerns about data responsibility are not new to development, but understanding the technology is.

Technology makes practitioners’ lives easier

Most importantly, technology-enabled M&E eases the work of practitioners. Imagine working in the field to collect information and instead of using pen/pencil and paper, you are using a tablet with a data collection app. This app allows you to work without internet connectivity and sync data when connectivity is available. You don’t have to worry about entering any geographic information, because it is either associated with a service location (e.g. school, community center) or the tablet saves your location for each entry.

M&E software companies, such as DevResults and SurveyCTO, create these tools so practitioners can focus on helping beneficiaries instead of recording and transcribing data. Field practitioners no longer need to record the same information in multiple locations and continually check to ensure no transcription errors occurred. Headquarters staff can use different types of data visualizations to more effectively develop theories of change and write reports much quicker.

By providing greater transparency, data responsibility, and making the the practitioners’ lives easier, technology is allowing practitioners to focus less on administrative tasks and more on effective program design.

To learn more about integrating technology and M&E in international development, sign up for our upcoming Technology for Monitoring and Evaluation online course.


Norman Shamas

Norman Shamas is the course facilitator for TechChange’s Technology for Monitoring and Evaluation online course. He also currently works as a data architect and wrangler to analyze foreign aid data at Creative Associates International. Previously he worked as a graduate student instructor at the University of Minnesota, where he studied identity from theoretical, social science, and policy perspectives. He has extensive experience in Israel and the West Bank where he has worked as an archaeologist and led dialogue groups. Norman speaks Hebrew and Persian and reads numerous dead languages. Norman enjoys telling stories, whether in words, images, or numbers. He has more than five years of experience teaching online and in person and facilitation in the US and abroad.


For my final project for TC105: Mobiles for International Development, I decided to interview Amy Sweeney of GeoPoll, one of the guest speakers of our class. Working on global development issues, I am deeply interested in new opportunities offered by technology, particularly how it allows people living even in the poorest countries to share information through mobile devices. GeoPoll strikes me as one of the most innovative players in this field and for this reason I decided to go back to Amy and ask her to describe GeoPoll’s work in more detail.

Since the interview I have also been amazed to learn that some of my colleagues at the organisation I work for, the OECD, already collaborate with GeoPoll on a ‘data revolution’ project that will contribute to more accessible information on development in the next few years… one more proof that there are no coincidences in life. I am now in touch with them on a regular basis to see how the project will evolve.

Interview with Amy Sweeney, Director of Business Development, GeoPoll

GeoPoll is a mobile survey platform that allows you to carry out mobile surveys in any country in the world except North Korea. Technically GeoPoll is registered as a US small business but it sees itself more as a social enterprise. It is eligible for both grants and contracts by US and international funders alike.

GeoPoll Overview

1. How would you define your added value compared to your competitors? What is your unique approach to mobile surveys?

GeoPoll’s approach is to reach as many people as possible regardless of their income or status. While many mobile surveys require the use of the Internet or web-based applications, we offer the opportunity to take a survey just by using any mobile phone (e.g., feature phones all the way up to smart phones). We aim to reach a greater portion of the ‘bottom billion’ people through simple text or voice messaging. There are other players in our market, particularly local companies, but we are different in that we establish partnerships with mobile network operators. We serve as a platform but also serve as a “sample  source”. We have access to more than 150+ million mobile subscribers in Africa alone. We can achieve more reach, scale, and connections with these operators than anyone else.

GeoPoll – How Our Platform Works

2. Who are your primary clients? Do you foresee any major change in their composition?

Roughly half of our business is with the social sector, e.g. international organisations like WFP and USAID, NGOs, etc. The remaining half is with commercial companies and market research groups but this percentage is likely to increase this year due to recent media measurement products produced.

3. Are you planning to collaborate again with the World Bank and the UNDP My World Survey?

The collaboration with the World Bank in 2010 was for the World Development Report focused on community-based consultations on gender-based violence in DR Congo. World Bank’s annual World Development Reports cover a different topic and a different country every year. At the moment there are no plans to collaborate again on a World Development Report in the near future but we are exploring other opportunities with the World Bank. The same goes for the My World Survey.

4. How do you ensure free participation or even incentives for survey takers? And who covers these costs?

GeoPoll connects with mobile network operators’ billing systems allowing mobile subscribers to participate in mobile surveys at no cost (e.g.:. zero-rated or free to respond to). For example, those that do not have airtime credit on their phones can still participate. Each carrier is different but ultimately our agreement with them ensures that the survey comes at no cost to the survey taker, which reduces the economic barrier for participation.

5. Is there such a thing as an average response rate? Does it vary across regions, gender or any other big factor?

Responses to our surveys really depend on the country and the topic in question. We have noticed that the response rate increases over time as survey takers get to know GeoPoll as a reliable service. Once trust has been built people feel more comfortable taking the survey. Also, we have done some testing that shows that response rates tend to increase with incentives. Another approach we have taken which has been widely successful is running panel-based surveys, including measuring TV viewership and radio listenership ratings, in several African countries. In that case, response rates have been astronomically high because users are engaged on a daily basis.

I hope you will find this interview useful. I’m excited to see that Amy Sweeney is coming back as a guest speaker for TechChange’s upcoming Mobiles for International Development course! Also, feel free to connect with me via Twitter (@faridabena) to continue our discussion on mobiles for development.

Interested in mobile data and other ways mobile phones bring understanding to the world? Join our upcoming online course on Mobiles for International Development.


About Amy Sweeney

Amy Sweeney

Amy Sweeney is the director of business development for GeoPoll based in Washington, DC. Prior to joining GeoPoll, Ms. Sweeney spent nearly five years developing and honing her international development experience at Chemonics, where she held the position as new business director in Caucasus and Central Asia RBU. She previously served in the Peace Corps in Uzbekistan and worked in Afghanistan and Turkey. She holds a bachelor’s degree in journalism and mass communications from the University of Wisconsin-Madison.

About Farida Bena

Farida Bena

Farida Bena is the Economist / Policy Analyst at Organisation for Economic Co-operation and Development (OECD) based in Paris, France. She has more than 15 years of experience working in development, humanitarian aid, and global advocacy across four continents. Before joining OECD, Ms. Bena has worked as the director at the International Rescue Committee Belgium and led the Aid Effectiveness Policy team at Oxfam International. Ms. Bena holds a master’s degree in International Relations from Yale University.

My current focus on tourism development led me to explore how some of the tech tools discussed in the Mobiles for International Development class can be applied in the tourism industry. In particular, a large part of the tourism assessment and development process involves both evaluating the visitor experience in a destination and examining the attitudes of local residents towards tourism development.

Surveys are the most common tools for carrying out these evaluations, but most of the time they result in stacks of papers that need to be keyed into a computer, introducing errors and wasting valuable time. In the M4D class, we saw a physical example of this where a pickup truck was loaded with stacks of questionnaires.

Today, mobiles and tablets are overcoming the challenges faced by paper-based surveys and evaluations as they bring efficiency, a variety of user-friendly survey platforms, and real-time feedback.

1. Quick and easy access to better processed surveys
Compared with paper questionnaires, a more efficient data collection method would be to use the Formhub tool that we learned about during the course. The additional cost of purchasing a few basic tablets and rugged cases could be offset by savings in labor costs for data entry and the added value of the data being processed in a more timely and accurate manner.

2. Variety of user-friendly survey platforms
The advantage of a tablet over a smartphone is that the tablet more closely resembles a paper format questionnaire, making it easy to hand over to visitors or residents to complete. Formhub can also be used offline; completed questionnaires can be uploaded once a connection is reestablished, making it particularly useful in remote tourism destinations lacking wifi or cell service.

Since visitor surveys are usually carried out in places where large numbers of tourists congregate (city plazas, transportation system waiting areas, etc.), the survey-takers often hand out paper forms to many people simultaneously, presenting a potential disadvantage for Formhub if only a few tablets are available. A potential solution could be a QR code to scan that takes tourists to a web site on their own personal smartphones to complete the questionnaire. This method could be used in conjunction with the tablets (i.e. tablets could be used for those visitors without smart phones). There would have to be measures in place to ensure that the same person doesn’t submit multiple questionnaires, but I think that could be designed relatively simply.

3. Real-time feedback
Another way to make surveys valuable to both tourists and destination planners and developers, would be to couple geolocation with an SMS service. Tourists could opt in to the program upon arrival at a destination, and upon entering certain geofences they would automatically receive an informational text describing the attraction with links to more information if they’re interested. For instance, upon approaching a monument a visitor could receive historical information about the attraction, or upon entering a local market the user could receive a link to a detailed map showing where certain stalls are located. This system could be coupled with an SMS survey system like TextIt. This way, the destination could get real-time feedback from tourists about certain aspects of an attraction as the visitor is experiencing it (i.e. rating scale questions about customer service, facilities, etc.). This would help to eliminate the problem of recall bias that often exists when tourists are asked to recall certain aspects of their trip days (or weeks) after it’s over.

There’s obviously a ton of potential for mobile tech in the context of tourism, from the inspiration and planning stages, to booking and experiencing, to sharing the tourism experience with others. I’m super excited to see what kind of apps and novel technologies will be launched in the next few years to further enhance and add layers of value to the tourism experience.

About Jason Kreiselman

Jason Kreiselman

When he’s not backpacking through far-off corners of the planet, Jason Kreiselman works as a digital marketing specialist with Brand USA in Washington DC helping to promote international visitation to the U.S. He also works with the International Institute of Tourism Studies conducting tourism research for public and private sector clients. Jason spent four years in Ecuador as an ICT Advisor to the Peace Corps where he worked to promote small businesses and secure grants for organizations focusing on environmental conservation and sustainable development.

Jason holds a Master of Tourism Administration degree with a concentration in Sustainable Destination Management from The George Washington University. You can find him on LinkedIn here.

Interested in learning more about this topic of digital options for surveys and evaluation? Register now for our Technology for Monitoring & Evaluation online course, which runs 26 January – 20 February 2015.

What role can mobile phones play in distributing a survey and collecting feedback and data from respondents? In particular, how can we use mobile technology to reach out to and engage individuals in developing countries that tend to be underrepresented in global surveys?

In the recent My World 2015 survey launched in December 2012 in honor of the end of the Millennium Development Goals in 2015 and the establishment of a new “post-2015” global development framework, the United Nations Development Program, the UN Millennium Campaign, the Overseas Development Institute, the ONE campaign, and over 700 on-the-ground grassroots organizations as well as international and local information technology companies created and continue to implement a worldwide survey seeking to collect the opinions of individuals everywhere on what matters most to them when it comes the future.

Survey respondents are asked to vote on 6 out of a possible 17 policy priorities, including a fill-in-the-blank priority that the individuals can add themselves. The survey aims to examine the public policy priorities of individuals across the globe. The survey allows respondents to choose 6 out of 16 pre-selected priorities or to submit their own priority in a 17th ‘fill-in-the-blank’ option. Respondents have participated in the survey via pen-and-paper ballot, via a central website, and through mobile technology (SMS, IVR, and a mobile application).

Here are five findings on the ways mobile phones have been leveraged for distributing the My World 2015 survey:

1. About 20% of over 2 million votes have come in via mobile phones.

2. Over 70% of the mobile phone respondents live in developing countries. These participants came from nations that score low on the Human Development Index (versus 31% in the overall survey).

3. More men have responded via mobile than women. (at a rate of 2 male respondent for every one female), and respondents via mobile tend to prioritize better job opportunities at a slightly higher rate than the majority of respondents.

4. Mobile distribution benefited heavily from local and international partnerships and, as with the web, more immediate and centralized collection of the data was possible. In implementation, the mobile phone promotion and distribution of the survey differed slightly from the pen-and-paper and web distribution of the survey.

5. A survey is only as effective as its promotion and distribution. Local and international partnerships helped distribute the survey through targeted high tech, low tech and no tech campaigns. Promotion for all three of the survey distribution methods included integrated campaigns targeting specific national and regional audiences as well as ongoing global efforts to raise awareness and foster interest in the survey.

How do these results so far compare to your own surveys? What kind of mobile data collection methods have you used in your projects and organizations? What challenges have you faced in gathering this feedback and engaging with survey participants in developing countries?

Linda Warnier OECD

Linda Warnier is a Communication Officer at OECD and an alumna of TechChange’s Mobiles for International Development online course. She develops and implements digital strategies and uses paid and free tools to plan and perform online impact assessments for large international organisations including the OECD and, before that, the European Commission.

To read Linda’s full report of My World 2015 and Mobiles, please click here.

===

To discuss this topic and similar issues related to mobile phones and data collection, be sure to join us for our upcoming online courses on Mobiles for International Development course and Technology for Monitoring & Evaluation!

On February 26, USAID received the “Best Government Policy for Mobile Development” award at GSMA’s Mobile World Congress 2013. And while the Mobile Solutions team was receiving an award in Barcelona, TechChange and the MS team were also receiving over 1,500 mobile poll responses from recipients in DRC taking part in an online exercise designed by 173 USAID staff and implementing partners in 21 countries. The way this was possible is through harnessing the same potential for public-private partnerships used for external implementation and applying it to internal education and collaboration at USAID.


Fig. 1: MapBox visualization of GeoPoll responses.

The exercise was part of a 4-week online course in Mobile Data Solutions designed to provide a highly interactive training session for USAID mission staff and its implementing partners to share best practices, engage with prominent technologists, and get their hands on the latest tool. Rather than simply simulating mobile data tools, USAID staff ran a live exercise in DRC where they came up with 10 questions, target regions, and desired audience. The intent was to not teach a tool-centric approach, but instead begin with a tech-enabled approach to project design and implementation, with an understanding of mobile data for analysis, visualization, and sharing.


Fig. 2: Student locations for TC311 class.

This would have been a formidable exercise for any organization, but fortunately we augmented USAID’s development capacity with the abilities of three organizations. TechChange provided the online learning space, facilitation, and interactive discussions. GeoPoll ran the survey itself using their custom mobile polling tool. And MapBox provided the analysis and visualization needed to turn massive data into a simple and attractive interface. (Want to check out the data for yourself? Check out the raw data Google Spreadsheet from GeoPoll!)

But while the creation of an interactive online workshop for small-group interaction requires barriers to scale, the content is under no such restrictions. One of the videos from our previous course on Accelerating Mobile Money provided an animated history of M-PESA, the successful mobile money transfer program in Kenya, which allows everything mobile phone users to pay for everything from school fees to utility bills and is proving transformative in cases such as Haiti.


Fig. 3: M-Pesa animation used for TC311 and USAID Video of the Week

But there’s still plenty of work to do. As mobile phones continue their spread to ubiquity, the challenges for applying their potential to development will only increase, along with the continuing possibilities as the technology continues to improve. However, in the short term, we’re focused on increasing mobile access, which is the topic of our next course. If you work at USAID or with an implementing partner, we hope that you’ll consider joining us and lending your voice to this process.

This is a guest post by Matt McNabb, Principal of Caerus Associates. If you are interested in using mapping for digital organizing, consider taking our course Digital Organizing and Open Government. 


Today, my colleagues at Caerus Associates and I are able to announce the BETA launch of a new tool that helps businesses, NGOs, and governments collect, visualize, and share geospatial data in less developed emerging markets. We call it, CaerusGEO.

Geospatial in the Last Mile

The premise is simple. How can we leverage the cloud to deliver geospatial analysis to non-GIS users most familiar with basic, paper based workflows?

In our experience, most businesses, government institutions, and organizations in frontier markets rarely use technology across the enterprise. In some cases it’s a cost issue, in others it’s social stigma related.  But whatever the reason, ICTs are often used simply to support manual, tabular processes that already exist.

Want to run a survey? Use Word, Excel, and printer.

When it comes to spatial data, this challenge is only magnified. Collecting geospatial information can be hard enough, visualizing and sharing it can be even harder. As a result, geospatial information is often relegated to the expert user.  Of course, the GIS industry as a whole is trending towards accessibility, but rarely is it truly meaningful for most enterprises in less developed markets that simply want to know where things happen.

This is what got me interested in a tool widely used within the humanitarian response community called Walking Papers. The value proposition of Walking Papers has been that it extends geospatial data collection to pen and paper. Print off a map, mark it up, then convert what’s written into geospatial data. No magic. No optical character recognition. Just a simple paper insert that allows people without GIS units to collect spatial information in a way that could be easily geo-rectified.

The problem with Walking Papers is that it offers little back to the data collector. There is no visualization or data management. In fact, it’s really only a lightweight tool that lets the user print off a map and, through some gymnastics, let’s her then use it to edit a basemap on Open Street Map. It offers nothing for the non-technical user simply interested in using paper to collect information about events, or perceptions, or whatever other kinds of information one might be interested in seeing over the basemap.

For the past year, we’ve been wondering what it would take to create a tool that filled this gap. Let normal users capture geospatial data in paper formats and return analytical value once collected.

How It Works

This BETA of CaerusGEO is our first answer to this need. A user is able to create her own survey, find a place in the world where it will be centered, create an atlas and data collection sheets through a standard schema they created, and then manage, visualize, and share the data once uploaded. By bridging cloud analytics to paper workflows, we are able to drive value at enterprise level.

If you’re an NGO and want to integrate mapping into your polling, you can create a survey, manage the data, and facilitate sharing from start to finish. If you’re a business looking to understand your market, you can integrate it into your customer registration process and benefit from basic market intelligence. Although basic in form, the value is derived from a more reality-based understanding of workflows in these markets. Paper matters.

Smarter Public Safety

The very first place we thought to experiment was in the domain of public safety. What could be more obvious than the need for taking those antiquated paper and pushpin constructions used for crude crime mapping and making it more dynamic, analytical, and transparent?

As the Deputy Minister of Justice in Monrovia told me, ‘we send the police where the people are, not where the crimes are… this could help us see how to use our resources in a smart way.’ We can address this challenge by finding minimally intrusive places to insert paper maps into the pre-existing workflows of policing institutions and fusing them together for digital analytics by a single node with connectivity to the cloud.

In parallel, NGOs and violence observatories have the capacity to collect and share their own data, creating a basic framework opportunity for enhancing social accountability within the security sector domain. Perhaps most interestingly, by integrating paper-based mapping that connects to real geospatial data, the longstanding art of Participatory GIS in conflict management and of Crime Prevention Through Environmental Design can be used in so many more ways.

Driving Value For The Private Sector

Public safety institutions are not the only ones we have learned can find value here. It’s also a pull for private sector development, particularly in the bottom of the pyramid. Microfinance institutions and others engaged in understanding their customer base face similar challenges.

By extending geospatial data capabilities to private sector development institutions and retail organizations, we have the prospect of significantly improving the precision and reach of private sector particularly to underserved areas.

So Much To Learn

Bending ICTs to the real-world challenges and workflows found in the last mile holds tremendous value to public and private sector institutions alike. For us, this experiment with geospatial information is only the beginning. We hope you’ll join us and give us feedback as our experiment moves on.

Matt McNabb is a member of the Board of Advisors for TechChange, and a Principal with Caerus Associates. For more, you can follow Matt and CaerusGEO on Twitter:  @mattrmcnabb  @caerusgeo


Are you interested in learning with TechChange? Check out our next class: Digital Organizing and Open Government. Class starts April 8, 2013. Apply Now.

How can USAID use mobile technologies to more effectively collect, analyze and share data?  These are the central questions we will be addressing as part of a new course TechChange has developed in partnership with the Mobile Solutions team at USAID and QED.

USAID, together with its partners, has the opportunity to increase efficiency, improve the quality of the information its uses, and better meet USAID goals related to its Forward Reforms, Evaluation Policy, and Open Data Initiative by utilizing mobile technologies to collect and disseminate data about people, projects, and programs. This course will help USAID Missions and implementing partners understand how to do just that.

Building off of the success of our 8-week online certificate course this fall on Accelerating Mobile Money, TC311 Mobile Data Solutions will be a four week online course (February 1-March 1, 2013) designed to build the necessary technical capacity to deploy mobile data collection strategies by bringing together Mission staff and implementing partners. The four weeks are structured as follows to provide a comprehensive overview of mobile devices in data collection.

Week 1: Introduction to mobile data solutions

  • What is mobile data? What are the benefits and challenges associated with collecting data wirelessly?

Week 2: Project design

  • Designing projects and preparing concept notes, scopes of work, other documents to include mobile technologies.

Week 3: Implementation

  • Study design and programming, training, field operations, data management

Week 4: Analysis, visualization and sharing

  • Utilizing data for decision-making, sharing with partners

The course will go beyond explaining the benefits of this approach. Participants will learn the questions to ask in order to assess projects (Are mobile technologies appropriate?); design them to achieve the maximum benefits possible (How should interventions be designed to take advantage of these technologies?), implement them (What device should we use? How do we train staff? What resources do we need in the field? At the Mission?), and report and share the data (How do we create visuals that can inform decision making? How do we share the results with beneficiaries and partners in-country?).

Featured tools, organizations and projects include: Episurveyor/Magpi, FormhubSouktel, EMIT, uReport, TexttoChange, RapidSMS, GeoPoll, iFormbuilder, PoiMapper, Catholic Relief Services, DAI, NASA, OpenDataKit at UW, SweetLab, JSI, ICF International, Tangerine at RTI, Futures Group. The course will be delivered on TechChange‘s custom learning platform and will include a mixture of presentations by experts, tool demonstrations, selected readings, and activities including designing and analysing a survey using mobile software.

This closed course is intended specifically for USAID and its implementing partners. But if are you interested in learning with TechChange and the topic of mobile data, Check out our upcoming course on Mobile Phones for International Development. Class starts on March 4, 2013. Apply now!

“Team Rubicon is doing for disaster response what the Obama team did for political campaigns,” said Jonathan Morgenstein while taking a break from tearing down moldy drywall in hurricane-damaged Rockaway, Brooklyn. A New York native and US Marine Corps veteran who served two tours in Iraq, Morgenstein had spent the last month working on the campaign trail with Veterans and Military Families for Obama. He was referring not to the nearly fifty volunteers he was coordinating that afternoon, but rather the sophisticated software back-end that he was relying on to provide the correct information attached to the clipboard he was carrying. In the same way that better technology such as “Narwhal” had been credited with assisting him only weeks earlier for turning out more volunteers, donors and voters than in 2008 for Obama (“When The Nerds Go Marching In,” The Atlantic, 11/16/12), it was now playing a core role in coordinating disaster response in New York.

Jon Morgenstein in Rockaway, Brooklyn

Jon Morgenstein in Rockaway, Brooklyn

And on November 18, Morgenstein needed the help. In collaboration with Team Rubicon, he was responsible for supervising 48 Clinton Foundation volunteers to gut ten hurricane-damaged homes in preparation for their restoration by contractors. Morgenstein was one of hundreds of volunteers helping out with Team Rubicon during the Clinton Global Initiative’s “Day of Action for New York,” which pushed Team Rubicon organizing capacity to the limit. While it’s difficult to estimate exactly how much value has been returned to the community, gutting just one of the houses was estimated at $5,000-$8,000 for a homeowner without insurance (in this case a 91-year-old), making a direct value-add beyond food and shelter relief. And each house was tied to a work order and a map on Morgenstein’s clip board, just like while canvassing before the election.

But this particular software by Palantir Technologies wasn’t designed for campaigns, rather having been used recently for finding IEDs in war zones like Iraq and Afghanistan. According to a post on CNN (10/4/12), Palantir “software ties together intelligence data to improve information for troops about the possible location of roadside bombs planted by insurgents.” Nonetheless, it was also a perfect fit for an organization like Team Rubicon, which “unites the skills and experiences of military veterans with medical professionals to rapidly deploy emergency response teams into crisis situations.”  While the outpouring of people wanting to help has been heartening, new problems arise when organizing large groups of ad-hoc volunteers.

Volunteers from the Clinton Foundation  (Credit: Jon Morgenstein)

Volunteers from the Clinton Foundation

Fortunately, the tech fit the mission. Far from having an existing organizational structure or a known set of capabilities (like a proper military unit), this had been a seat-of-the-pants improvised human logistics, making those most in need with those most capable.  Palantir’s philanthropic team had been discussing doing some disaster-relief simulations to test its capabilities for this use.  When Sandy suddenly threatened the eastern seaboard, the drill became the real thing, with Palantir scrambling to set up the server infrastructure and mobile handsets for Team Rubicon’s use. (“Philanthropy Engineers Embed with Team Rubicon for Hurricane Sandy Relief,” Palantir Blog, 11/14/12)

The setup was ready by November 4th, just as recovery operations were swinging into gear. Imagined as operating system for data problems, Palantir’s software was able to pull in information from multiple sources of data, fuse it together into a coherent picture of the state of the peninsula, and then allow Team Rubicon operators to efficiently dispatch volunteers (say, a chainsaw team) to where they were needed the most (a list of the fifteen biggest downed trees). But tech isn’t perfect. “Check the data. At the end of the day, just because it’s in Palantir doesn’t make it right.” stated Brian Fishman of Palantir from inside the bus HQ. “Circumstances change, and a functional technology infrastructure requires regular updates to the data in the system.”

So, will Palantir and Team Rubicon change the way organizations think about disaster response? “I don’t know, maybe,” stated Morgenstein, “In the military we say, ‘Amateurs talk strategy, pros talk logistics’. These tech guys have made the logistics a lot easier at the operational level, and the military culture you see in Team Rubicon of delegating decision-making downwards to the person closest to the problem, is perfectly suited to an operation like this.”

Brian Fishman of Palantir at Team Rubicon FOB Hope

What we do know, however, is that putting the right tools in the right hands has the potential to create a team where the whole is greater than the sum of the parts. With Palantir and Team Rubicon, response operations will continue to iterate and improve over time, with the ultimate goal being to develop better response mechanisms for the next time disaster strikes. The best indicator of Team Rubicon as a learning organization may have nothing to do with the technology. At the end of the “Day of Action,” our team leader Zach (pictured, below right) turned to the group and asked us: “What could we do differently? If you see something you think we could be doing better, please let us know so that we can keep getting better at this.” Even when it comes to disaster response, tech is only ten percent.

TechChange provides online training in Tech Tools for Emergency Management. If you’re interested in learning more, consider applying for our next course. Class starts Jan. 14!

Interested in joining Team Rubicon? Please consider donating time or money to further their work. Learn more about Team Rubicon.

Zach and Dan of Team Rubicon

Zach and Dan of Team Rubicon