How do you make the invisible visible? How can we keep up with our ever-changing world, and how can we utilize the technologies of our time? Upon the completion of TechChange’s Mapping for Social Good course, we have found that some answers lie within the realm of digital mapping and geospatial data collection.

From Theory to Practice

The course features four weeks of case studies and real-world map applications, a diverse set of guest speakers, and innovative tech tools to invoke critical spatial analysis with social and environmental perspectives. Each new week introduced a set of social and environmental themes. Issues such as Water, Sanitation, and Hygiene required an advanced geographic understanding of land use and climate patterns to produce meaningful maps, and cutting edge tools such as CartoDB, Mapbox, and Leaflet empowered our understanding through spatial analysis.

In search of balance, participants discussed the necessary steps in designing an attractive, efficient, and safe urban infrastructure in Abu Dhabi, and discovered the complexity of the plan. Taking into account population, available surface area, and the availability of funds and resources, the course discussion forums were flooded with professional expertise and insight in how to build infrastructure that reflects the city’s urban lifestyle.

But Data Considerations Aren’t Only About Tech

A discussion on ethics can often be overlooked in this technical environment. But in Week 3, Nathaniel Raymond of The Signal Program on Human Security and Technology led a talk that highlighted recurring challenges associated with technology and humanitarian efforts. In doing so he introduced the concept of Demographically Identifiable Information (DII) – a close relative to that of Personally Identifiable Information (PII). His message put forth “Do No Harm” caution to humanitarians, encouraging critical thought and consideration for the most vulnerable populations in our world, remembering that we both hold, yet lack, so much power with technology.

Engaging Formal and Informal Institutions

Of note was the interaction between the global volunteer community of mappers and major donor institutions. A team of geographers and cartographers from the State Department’s Humanitarian Information Unit joined the class to discuss Mapgive and Imagery to the Crowd, a program that provides satellite data to global volunteers during times of crisis, and shows just how far the digital humanitarian community has come in the past decade.

Interactivity in Online Education

Throughout the course, participants presented their digital maps, addressing fundamental questions like, “what is the purpose of this map?” and, “will it give us exactly what we need, or simply what we think we need?” We’ve seen land-use maps of Washington, DC, conflict maps tracking violence against civilians in Libya using QGIS, and district density maps using the CartoDB application.

Upon completion of the TechChange course, “Mapping for Social Good,” we hope that participants feel well-equipped with some of the best mapping resources of our time, and that they have taken their professional experiences to new and challenging levels.

About the Authors
Madeline is a student at James Madison University, where she studies Political Science, Humanitarian Affairs and Geographic Information Systems, with a special interest in Conflict Resolution and International Landmine Prevention. In her free time, she loves to bike, paint, and eat chocolate pie while listening to Dave Brubeck.Madeline Profile Picture

Greg works on training and analytics with the Bureau of Conflict and Stabilization Operations at the US Department of State. He has spent his career working at the intersection of conflict resolution, technology, and the arts. Trained as a mediator, he also worked with the Northern Virginia Mediation Service and the US Institute of Peace. As a technologist, he has leveraged Geographic Information Systems for health interventions, humanitarian response, and conflict analysis purposes. He holds an MA in International Studies from the Josef Korbel School of International Studies at the University of Denver.Greg Maly Profile Picture

Mobile Health: How Far We’ve Come

When I first started in the field of technology for development back in around 2010, I was working specifically in global health tech, and there weren’t too many of us around. The idea of using technology in places besides the developed world was just starting to gain traction, and even then, it was limited to mostly technologists and a few health experts. Pilotitis was infecting everyone, and every project I worked on for the first few years was a pilot of some sort, with no solid plan to move beyond that stage. The focus was on finding tools and concepts that showed evidence of working, although that ended up being a more difficult task than everyone expected!

Recognizing this, the mHealth Alliance (formerly part of the United Nations Foundation) created programs to incentivize all the many organizations out there to move past the pilot stage and begin exploring how to scale their projects, and eventually other organizations followed suit. Even then, though, the health field at large was still a bit unsure about how to treat digital interventions, especially in terms of evaluation. Do you measure the success of an SMS stock monitoring tool by just counting how many times it was used, or do you count the many patients who were treated using those very drugs kept in stock? Is there even one right way to measure it?

Additionally, nobody could really agree on what terms like “scale” and “sustainability” meant for mobile health tools. It wasn’t until more recent years that the space has truly started to embrace that the definition of “scale” and “success” varies for each project, and that planning for sustainability is paramount for a mobile health product to truly make an impact.

These days, among many lessons learned, it’s widely recognized that like any technology, mobile health tools are great for targeted usages, but at the end of the day, they are just tools that cannot solve problems on their own. Even the sleekest vaccination reminder system, for instance, must be accompanied by an equally well-run vaccination program for it to really benefit a community.

The mobile health community, additionally, has expanded significantly to include a wide variety of experts and crossover roles, from doctors to designers and software developers to supply chain experts. This has contributed to an increasingly holistic view of mobile health, rather than the siloed space that it once was – which is a good thing! The more perspectives you incorporate into projects, the more likely you are to come up with a truly innovative and engaging product.

Looking Forward in Mobile Health

It’s hard to say what the next big breakthrough in mobile health will be, but we’re already starting to see a rise in the number of projects that incorporate more advanced technologies like sensors and wearables alongside mobile phones. These types of additions have the potential to reduce the amount of time and resources needed to activities that currently serve as barriers to access and utilization of health services. We’re still figuring out how these sorts of tools can be best incorporated into healthcare, even in the western world, but we’re making progress. The UNICEF Innovation team even just began testing the usage of drones to speed up the process of testing infants for HIV, which brings a whole new meaning to the concept of “mobile” health tools!

Personally, I think that the biggest changes coming ahead in the near future will not be so much in the tools themselves, but rather in how we use existing tools. With the rise of patient records and other consolidated data sources around the world, I think we’ll soon be seeing a bit more of personalized medicine in the developing world, which will help bring customized care to places where it otherwise would have been difficult to provide. Similarly, better data analytics will lead to smarter interventions – for instance, we’ll have a much better sense of exactly what types of diagnoses are prevalent in specific areas, and thus be able to better support clinicians with their precise needs. And it may sound crazy, but if you want to really look ahead, I do think we’re much closer than you’d imagine to our futuristic vision of robots supporting clinics in hard-to-reach areas. The technology for that exists; it’ll just be a matter of finding ways to make it affordable, accepted, and safe enough to use! That would open up all kinds of new doors to allowing patients with mobile phones to directly connect to their healthcare.

Regardless of what the future holds, one way that you can be prepared to participate in it is by learning more about the space at large, which is why the TechChange Mobile Phones for Public Health course is such an exciting resource! I look forward to meeting the students taking it and seeing the kind of impact they’re able to create.

About the Author
Priyanka Pathak is a technologist and digital designer whose work focuses on co-designing and co-creating technologies for social impact, especially in global health and STEM education for women. Currently, she is a Senior Designer at the Design Impact Group at Dalberg. Previously, Priyanka worked as an ICT and Innovation Specialist at the World Bank, in addition to having taught courses around design, technology, and social good at Parsons the New School and the Copenhagen Institute of Interaction Design. Priyanka holds a masters degree in informatics from Columbia University and bachelors degrees in information systems and business from the University of Texas at Austin, and is currently based in Washington, DC.

pathak_profile B&W

On Wednesday, January 21, TechChange officially launched the Alternative Grad School (AGS) track of our Tech for M&E Diploma Program. The Alternative Grad School track builds upon the Working Professionals Experience, providing a highly personalized experience for participants focused on professional development and career services.

As part of this program, students participated in a three-day in-person orientation in Washington, D.C. with the TechChange team. They worked on portfolio development, planned for their mentorship program, were placed with a capstone partner, and made connections with key players in the industry during site visits. Participants are given an educational foundation to help further these experiences by taking our Technology for Monitoring & Evaluation, Technology for Data Collection and Survey Design, and Technology for Data Visualization facilitated courses, which are ongoing.

Meet the Spring 2016 AGS Participants

Laurie Cooper

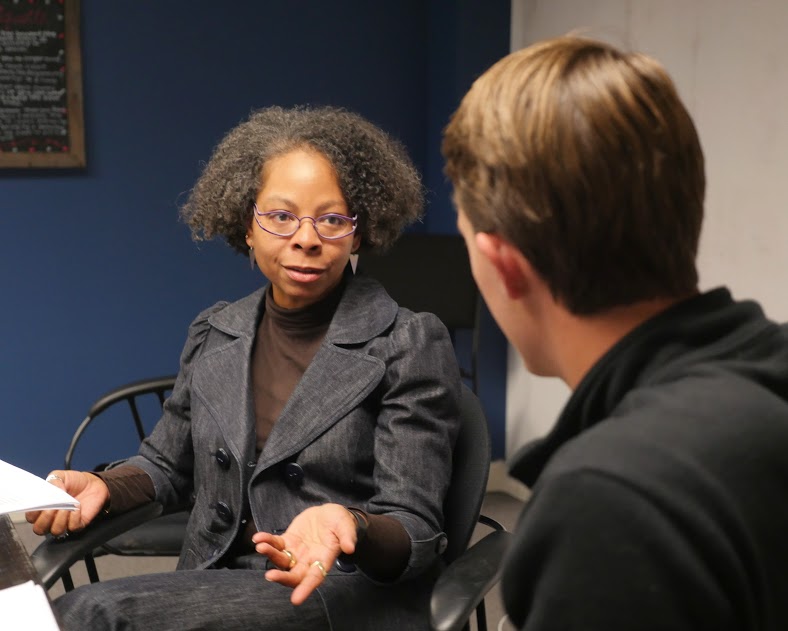
Laurie Cooper is a collaborative dispute resolution and governance specialist, with twenty-five years of experience in program management in Sub-Saharan Africa and the Middle East. She is passionate about working with civil society organizations, political party and government officials, and international NGOs. She has a solid foundation in rule of law, advocacy and accountability issues. Ms. Cooper worked in more than a dozen African countries on democracy development programs. She speaks French, Portuguese and Spanish.

John Bunnell

John Bunnell is a young entrepreneur who is passionate about the ways adventure travel and technology can make a positive impact in development. He is currently planning the launch of his own foundation, which will combine humanitarian work and the outdoors. It will be an adventure company that helps support and advocate for NGOs, social change movements and environmental sustainability projects.

Grace Profile

Grace Lyn Higdon has over five years of experience working with social change organizations in the US and Africa, most recently supporting an impact evaluation measuring changes in equitable caregiving among fathers in Rwanda. She is passionate about safely incorporating ICTs to strengthen citizen participation and inclusion in the development project cycle, which will be the focus of her graduate work at the Institute of Development Studies in Brighton.

Yakubu

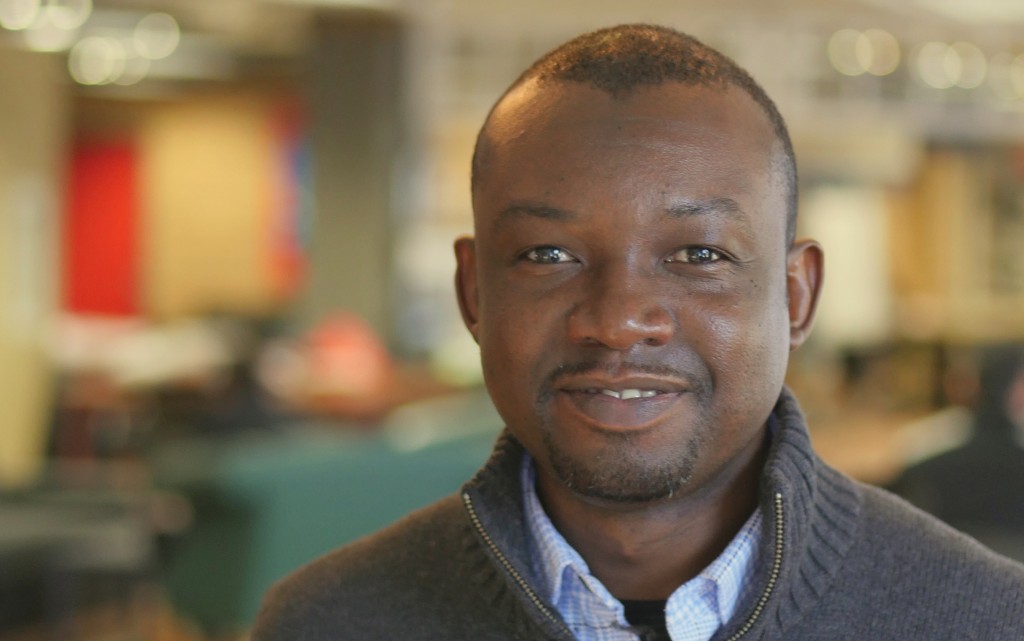
Yakubu Iddirisu has a diverse portfolio of skills, knowledge and experience in Business Development, Water & Sanitation, Gender, Environment and Infrastructure Development. He spent four years as an M&E Specialist for the West Africa Trade Hub, a USAID-funded trade facilitation project for twenty-one countries based in Ghana and Senegal. He holds an MA in Development Studies from ISS in the Netherlands. Yakubu currently serves as Health Promotions Coordinator and Leading Petty Officer in a Dental Clinic in the United States Navy Reserve.

Spring 2016 Orientation

The three-day, in-person orientation was held in Washington D.C. at 1776, “a global incubator and seed fund helping startups transform industries that impact millions of lives every day—education, energy & sustainability, health, transportation and cities.” During this three-day period, participants met stakeholders, went on site visits to international development organizations such as Creative Associates International and DAI, and participated in various career/professional development related sessions.

Want to learn more?

We’ll be featuring each of our students in upcoming blog posts, and they’ll be sharing their experiences with the TechChange community throughout the program. Follow us on Twitter at @techchange to see the latest from our students and the incredible work they will be doing!

To learn more about the Technology for Monitoring and Evaluation Diploma Program – and the Alternative Grad School add-on – head here.

Still have questions? Reach out to us at diploma@techchange.org.

P1490302


TechChange courses are designed for busy young professionals. In any of our courses, you will find yourself taking the course alongside international development field and headquarter staff, university professors and students, freelancers, and so many other kinds of eager learners. Today, we are excited to chat with Amira Elibiary, who is an M&E specialist and works for Tshikululu Social Investments in South Africa. After she submitted an insight piece she wrote about M&E as a result of her participation in our Technology for Monitoring & Evaluation course, we caught up with Amira to talk about her overall experience with the course and how it has impacted her work.

Q: How did you find out about TechChange, and what made you interested in taking a course?
I am a member of the MandE News Yahoo Group, which is a practitioner group for M&E professionals. Someone posted information about TechChange and the course in the group, so that is how I initially found out about it. At my organization, Tshikululu Social Investments, which is a fund manager for corporate social investment, I’ve been grappling with conducting data collection in an efficient manner and the M&E process in general. I decided to take the course to see what tools are out there because I felt that I was getting stuck in terms of thinking of new ideas.

Q: Have you taken online courses before? What did you think of the TechChange course and the style?
I had taken several online courses with other organizations before I took this Technology for M&E course with TechChange. I found it a bit hard at first to get accustomed to and navigate the platform, but once I got used to it I really enjoyed the course and the setup. I liked the TechPoints system, which did not exist in other courses I had taken. The TechChange course was also definitely more interactive than the other courses I had taken. I was able to have discussions with other participants in the course, and most of my problem solving and ideas came from this sort of engagement with other students and from hearing their experiences. The content of the course was also great, especially the guest speakers.

Q: What level of experience did you have with tech for M&E going into the course?
I work a lot in the M&E field but going into this course I knew about some tech for M&E tools, but I didn’t have a lot of exposure to and experience with them. This did not pose a problem for me, however – the material was not hard to understand or to follow, and has definitely increased my knowledge of the M&E field as well as the various tools out there.

Q: How did you use what you learned in the course at your job and in your work?
I would say that the main way that what I learned in the course has been applicable to my work is in terms of bringing in more ideas. At work we get a lot of different service providers that come to us offering us their tools, and I feel that now I am more knowledgeable and better equipped to decide between these tools.

More specifically, the guest expert that spoke about the issue of privacy has impacted my work as well. The insight piece that I wrote for my company’s blog about the issue of privacy and M&E was in part a result of my participation in this course. This presentation made me stress the issue of privacy more with my colleagues. As M&E practitioners, we are aware of this issue but maybe don’t think about it as actively as we should. This aspect of the course brought more attention to the fact that it is people that we are collecting data from, not just numbers.

I also have begun to think more about local contexts. For example, in the course we talked about how most people in the developing world are connecting to the online world via mobile phones rather than desktop or laptop computers, which many still do not have. This has caused me to consider that perhaps we should begin to use some mobile tools for M&E, or at least be choosing tools that are also mobile compatible.

Q: What advice would you give to other participants in order to for them to succeed in the course and gain the most from this experience?
When I was taking the course I didn’t always have time to attend all the guest expert sessions live because I was busy with work; I went back and watched most of them later in the months following the end of the course. I do regret not attending more of the events live because it would have been a much better tool for learning and I would have had the opportunity to ask more questions directly. So, I would probably tell students that they should browse through the course calendar at the beginning of the course and pick a few live events during the four-week period that they are most interested in and plan into their schedules to attend those.

The second piece of advice I would give to students is to actually use and take advantage of the knowledge within each course participant. There are a huge range of participants that all have different backgrounds and areas of expertise and, as I mentioned earlier, most of my problem solving was a result of discussions that I had with other participants.

Interested in taking this course? New session begins January 25, 2016. Apply and sign-up for our Technology for Monitoring & Evaluation course here in order to gain new skills and join an incredible network of professionals from all over the world! For a full list of the courses we offer, feel free to visit our online course catalogue

About Amira

photo (1)
Amira Elibiary is a Monitoring and Evaluation (M&E) specialist with 10 years of experience in research, grant-making and program management; over two years of experience in the corporate social investment sector for education, health and social development projects. With a keen interest and extensive experience in democracy, governance, advocacy and rule of law work. Amira holds a Master’s degree in International Affairs from American University and a BA degree in Economics.

Today is International Day of Persons with Disabilities.

Persons with disabilities constitute the world’s largest minority, 80% of whom live in developing countries – an estimated 800 million people. Approximately 20% of the world’s poorest people have a disability. In response to this reality, the United Nations (U.N.) adopted seven disability-related targets (e.g. Targets 4.5, 11.2, 11.7) as part of the new Sustainable Development Goals (SDGs) developed in October 2015. (UN Enable)

Persons with disabilities should therefore be key stakeholders and beneficiaries of any development or humanitarian initiative, and monitoring and evaluation (M&E) systems should be capturing how programs impact them. Below are some resources that outline how technology can act as a tool to facilitate the inclusion of this largely marginalized population in M&E processes.

disability-logo

Core Data
Valuable program or country-specific data about persons with disabilities to collect during M&E may include:

  • Disability prevalence, disaggregated by type of disability, age and gender
  • Definitions of disabilities to compare to World Health Organization (WHO) and other definitions
  • Legal framework
  • Policies on segregation, institutionalization or community-based rehabilitation in health, education or penal systems
  • Education and employment rates
  • Representatives in government and civil society
  • Program administration data (i.e. rates and modes of inclusion in an activity, program or organization)

Early and consistent collection of this data is needed to determine where and how M&E can best occur in collaboration with persons with disabilities.

Using global datasets can increase the efficiency of data collection and facilitate comparative analysis. See:

E-accessibility
E-accessibility is a measure of the extent to which a product or service can be used by a person with a disability as effectively as it can be used by a person without that disability.

E-accessibility should be among the criteria for choosing a device for data collection or dissemination. Consulting with local Disabled Persons Organizations (DPOs) can help determine if a tech tool will create barriers or enhance participation.

For example, mobile phones with hands-free, voice command features (think “Siri”) can enhance accessibility. Large print and screen reader compatible formats should be used to collect and provide information electronically to persons with impaired vision, blindness or dyslexia. Visual elements of documents, like photos, should have captions that can be read aloud. Radio or audio recordings deposited with a DPO can make evaluation results accessible across a range of disabilities. Real time captioning, or printing hard copies of the main script of a video or lecture, can increase inclusion of the hearing impaired. Braille printers (often available through a local DPO) can produce reports or surveys for the blind. These technologies enable persons with disabilities to participate independently and confidentially in surveys and other feedback mechanisms.

E-accessible technologies not only enhance M&E processes, but also can be low cost. Some operating systems have built-in automated voice read or Assistive Touch technologies. Software to read aloud or translate documents into Braille on-screen is often free (to read DAISY books, download here). Self-captioning software, such as Overstream and MAGpie, is also widely available for free. Training sessions for DPOs or enumerators on how to use these features or software may be necessary.

The following provide more information on e-accessible tools, methods and procurement:

Technology can change an environment that is disabling into one that is empowering by creating channels for persons with disabilities to have an equal voice in the programs that affect them.


About Leigh-Ashley
headshotlipscomb

Leigh-Ashley Lipscomb is an independent analyst and Adjunct Research Fellow with the WSD Handa Center for Human Rights and International Justice at Stanford University.

I’ve always been a visual learner. As a digital animator, one of my responsibilities is trying to make important information in international development and public health organizations easier to understand and share. With 65 percent of all people as visual learners, it is important in data-intensive fields such as international development and public health to have training content that is easy to digest through graphic organizers and data visualizations. I’ve learned how creating an animation or interactive graphic mimics the learning process: breaking down components of a concept and putting them together. When animating, I see the pieces of an animation as creating joints for a once inanimate object. I am always learning more about that topic as I break down components and put them back together.

When working with Johns Hopkins Bloomberg School of Public Health Center for Communication Programs (JHU∙CCP), USAID, and FHI 360 on their new Global Health eLearning (GHeL) Center online course, Health Communication for Managers, I learned about the basics of health communication for global development professionals and academics and tried to make it engaging with an interactive infographic.

Although the creative process in building out this interactive graphic was a constant feedback loop with many iterations, here are the basic steps of how the process of creating an interactive infographic works:

1. Map out the vision and purpose of the infographic, and understand its constraints
When crafting a training program for health communication for managers, the Knowledge for Health Project (K4Health) at the JHU∙CCP contacted TechChange to produce animation videos to create an engaging learning experience with its infographic. They gave us a lot of creative freedom to make one of the training’s main infographics interactive. After a consultation with JHU∙CCP, we all agreed on the vision for the interactive graphic and its purpose for the graphic to be intuitive, visually appealing, simple, and easy to understand. Then JHU∙CCP sent us reference materials that included a general brief of interactivity requirements for the platform and technical specifications.

Last year, GHeL went through a significant site redesign and now hosts its 65+ free courses on an open source, open access Drupal platform. JHU∙CCP was excited to test out the new site features and, in keeping with latest trends in online learning, was interested in adding an interactive layer to its primarily text based courses. However, the majority of GHeL learners access the site from low and middle income countries where access to high speed internet remains a critical barrier. Any interactive elements added to the site needed to load easily and quickly in low bandwidth environments in order to cater to learner needs.

We decided to go with HTML5, the latest standard for HTML, as it is becoming almost a universal standard in terms of web browser support. Where it was previously only possible to do this level of interactivity with graphics either with Flash (a technology that is almost obsolete with more flaws than advantages) or with rather complex javascript, authoring something like this in HTML5 with a product like Adobe Edge Animate is relatively easy and powerful. By using HTML5, we can create a lightweight infographic that can load with minimal bandwidth without losing any graphic quality or interactive elements. The infographic will not only load quickly, but it will also be accessible on a tablet or mobile device without loading any additional resources.

Starting with the initial static images in text, PDF, and .jpg format, JHU∙CCP informed us that they didn’t want just a basic .jpg image with hotspot (an area on an image that has a function attached to it); they wanted a bit of “edge” to it. As a result, we interpreted the graphic similarly to the Google Doodle interactive logos. However, we tried to keep the graphics consistent with static printed version of graphic, yet with an interactive element.

2. Convert and reformat content to be web-friendly & break apart the graphic itself into layers and components.

For the next step, I traced these .jpg files to stay consistent with the original graphics, which appear in other parts of the training. I then created vector files with certain colors using Adobe Illustrator. When working with these files, my thinking process involved questions such as, “What part of the graphic will be clickable? What colors will change?” I then made a basic mock-up in Illustrator and used Adobe Edge Animate (Adobe’s version to HTML5 animation that is similar to Flash) to combine the component. This simple animation tool lets you create animations by combining multiple images within a time frame.

3. Build interactivity and triggers into graphic
JHU∙CCP sent us a brief of each graphic with buttons and Adobe Edge Animate, HTML5 animation web development authoring tool. The software resembled animation tools used including basic Adobe software. I then created a timeline where different states of the graphic appeared, adding breaks between the states. For the concentric circles within the graphic, I had to create each circle as a separate asset (or a button, picture, graphics, icons, illustrations, texts; components of an animation/infographic/illustration).

4. Combine animation with web development
I worked with my colleague Matthew on addressing bugs and optimizing the interactive infographic for different window sizes. He also assisted with responsive design (or designing for multiple devices and services), quality assurance (QA) and worked out the HTML5 coding. As an animator, it was a straightforward process to build graphic assets on a timeline, but I had issues with “what happens when you press on the thing”. Matt coded a conditioning system that made transitions smoother and user-friendly.

5. Get feedback and refine (ongoing)
In total, we created five graphics. Throughout the process, there were small edits in the text. Overall, I approached this interactive infographic project like any other animation project, but with interactive elements.

To access the free online course on “Health Communication for Managers”, please click here.

Interested in animating some of your static training content? Contact the TechChange Creative team at info@techchange.org.

What role can mobile phones play in distributing a survey and collecting feedback and data from respondents? In particular, how can we use mobile technology to reach out to and engage individuals in developing countries that tend to be underrepresented in global surveys?

In the recent My World 2015 survey launched in December 2012 in honor of the end of the Millennium Development Goals in 2015 and the establishment of a new “post-2015” global development framework, the United Nations Development Program, the UN Millennium Campaign, the Overseas Development Institute, the ONE campaign, and over 700 on-the-ground grassroots organizations as well as international and local information technology companies created and continue to implement a worldwide survey seeking to collect the opinions of individuals everywhere on what matters most to them when it comes the future.

Survey respondents are asked to vote on 6 out of a possible 17 policy priorities, including a fill-in-the-blank priority that the individuals can add themselves. The survey aims to examine the public policy priorities of individuals across the globe. The survey allows respondents to choose 6 out of 16 pre-selected priorities or to submit their own priority in a 17th ‘fill-in-the-blank’ option. Respondents have participated in the survey via pen-and-paper ballot, via a central website, and through mobile technology (SMS, IVR, and a mobile application).

Here are five findings on the ways mobile phones have been leveraged for distributing the My World 2015 survey:

1. About 20% of over 2 million votes have come in via mobile phones.

2. Over 70% of the mobile phone respondents live in developing countries. These participants came from nations that score low on the Human Development Index (versus 31% in the overall survey).

3. More men have responded via mobile than women. (at a rate of 2 male respondent for every one female), and respondents via mobile tend to prioritize better job opportunities at a slightly higher rate than the majority of respondents.

4. Mobile distribution benefited heavily from local and international partnerships and, as with the web, more immediate and centralized collection of the data was possible. In implementation, the mobile phone promotion and distribution of the survey differed slightly from the pen-and-paper and web distribution of the survey.

5. A survey is only as effective as its promotion and distribution. Local and international partnerships helped distribute the survey through targeted high tech, low tech and no tech campaigns. Promotion for all three of the survey distribution methods included integrated campaigns targeting specific national and regional audiences as well as ongoing global efforts to raise awareness and foster interest in the survey.

How do these results so far compare to your own surveys? What kind of mobile data collection methods have you used in your projects and organizations? What challenges have you faced in gathering this feedback and engaging with survey participants in developing countries?

Linda Warnier OECD

Linda Warnier is a Communication Officer at OECD and an alumna of TechChange’s Mobiles for International Development online course. She develops and implements digital strategies and uses paid and free tools to plan and perform online impact assessments for large international organisations including the OECD and, before that, the European Commission.

To read Linda’s full report of My World 2015 and Mobiles, please click here.

===

To discuss this topic and similar issues related to mobile phones and data collection, be sure to join us for our upcoming online courses on Mobiles for International Development course and Technology for Monitoring & Evaluation!

Photo credit: First Access


In the fight against poverty, microcredit has been hailed as one of the most successful tools invented to help enterprising men and women build wealth in the developing world. Access to small loans has certainly been a game changer for many low-income individuals. I have seen microcredit make a positive impact on real people through my work at TechnoServe, a non-profit committed to applying business solutions to alleviate poverty. In fact, many development organizations are dedicated to similar business-centric initiatives, helping entrepreneurs build successful businesses by connecting them with capital, networks, and skills training. This work is vital to reducing poverty, but these organizations do not have the capacity to help everyone in need. There are still 2.5 billion men and women around the world without basic financial services.

During a recent course I took with TechChange on Mobiles for International Development, I was very impressed by First Access, an SMS-based loan assessment tool. This technology has the potential to give the 2.5 billion adults without a formal bank account an instant credit history. With a credit history, these individuals would have the ability to take out a loan. First Access uses pre-paid mobile phone data to assess credit risk and deliver a loan recommendation via SMS to potential borrowers in just a few seconds. Instead of sending a financial representative to a potential borrower’s house to assess risk, the loan representative could simply send an SMS.

This technology is impressive because it uses already existing financial and demographic data registered with telecommunications companies to determine loan eligibility. It is a more objective, standardized system, unlike the current loan assessment technique in many developing nations, which can be based on the materials used to construct your house or the opinions of your neighbors. First Access benefits all parties, particularly financial institutions by saving them time and money cutting down on the cumbersome loan assessment process, as well as phone companies through increased data usage and customer loyalty.

By using the already aggregated data for the 6.3 billion active mobile subscriptions around the world, First Access is, in many ways, simply acting as a liaison between different parties. To make the technology successful, strong partnerships with financial institutions and telecommunications companies need to be established. The alignment of interests will be a huge obstacle in many markets. First Access has the most potential for success in Africa, as many African countries are already using mobile money programs, which should make borrowers less reluctant to adopt the technology. However, First Access could be dangerous in countries where political, religious, or ethnic tensions are prevalent, as the assessment process might be forced to deny some applicants and grant loans to others.

Financial institutions bear the biggest risk in using this new technology to assess credit eligibility. First Access is unclear about how the assessment process determines the loan award, simply stating it is based on demographic, geographic, financial, and social information. It seems borrowers could manipulate the process by artificially inflating their social networks or using someone else’s address. The potential for a mobile phone black-market is even more of risk. A strong mobile device fraud-assessment would need to be built into the financial assessment process. This could easily be negotiated with the telecommunications companies to help increase legitimate phone sales, as well as lowering the risk for financial institutions.

First Access could potentially connect over half of the world’s population to microcredit services through its convenient loan assessment process. It’s quick, easy to use, and it doesn’t require excessive outside intervention, or hands on training. For the first time, these billions of unbanked men and women would be given the opportunity to start a business with the click of a button. This technology is empowering people by giving financial institutions objective, standardized data. No longer will people be judged by the material of their roof, but the data stored by their phones.


Tessa Ruddy is a first-year graduate student at the Elliott School of International Affairs at the George Washington University. She is studying international development and conflict resolution and recently took TechChange’s Mobiles for International Development course. She is passionate about the impact of development work in pre and post conflict communities, particularly the use of SMS-based technology to connect people with financial services.

Information and communications technology (ICT) is an integral component of the increasingly technology-driven global economic and social landscape. For many of us, ICT has become the principal way we communicate and get informed, shop or sell and increasingly how we learn, bank, advocate, get medical guidance or engage with our government. As the first generation of “digital natives,” ICTs – both old and new– have arguably become akin to a central nervous system among (many) youth. ICT has also become an essential component to improved outcomes across the domains of wellbeing, including civic participation, economic opportunity, education, health, and safety and security. This is particularly true for youth; at a local level, finances, transportation, information sharing, and innovation are increasingly linked with technology, and all represent important components to youths’ lives. As recent surveys have indicated, youth in emerging and developed economies alike are increasingly dependent on the internet; by the end of 2011, 45% of the 2.3 billion global internet users were younger than 25, and this demographic is projected to increase. Yet there remain large economic and regional disparities in global youths’ access to ICT. In 2012, just over 9 percent of Africans youth aged 15-24, and 79 percent of European youth, had used the internet for five years.

In the Global Youth Wellbeing Index that was recently released by the Center for Strategic and International Studies (CSIS) and the International Youth Foundation (IYF), we highlighted the importance of ICT in youth wellbeing. Of the forty indicators that comprise the Index, five make up the ICT domain and include access to electricity, households with radios, ICT for development score, digital natives, and youths’ dependence on the internet.

“ICT and youth have long been linked as new generation embrace new technology to improve their lives, find jobs, and engage their community.”

-Nick Martin, Co-founder and president, TechChange

A few key findings

Index findings indicate a strong correlation between ICT, countries’ income levels, and overall levels of youth wellbeing. Countries that perform best in ICT are generally those upper and upper-middle income countries that perform best in the overall ranking of youth wellbeing. South Korea, Sweden, the United States, United Kingdom, Germany, Japan, Australia, Spain, Saudi Arabia, Brazil are the top ten performers within the ICT domain, and nine of these countries, with the exception of Brazil, are top ten performers in the overall rankings.

There are significant disparities in ICT access and development between developed and developing countries, beginning with foundational access to electricity. Out of the six domains comprising the Index, there is the largest gap between the top and bottom performer scores in the ICT domain, with South Korea at .94, and Uganda at .18, indicating wide disparity in ICT development between the thirty Index countries. Developed countries have substantially higher levels of mobile phone and internet use, house more digital natives, and youth who indicate a higher dependence on the internet. There is a smaller, but still significant, gap in access to electricity and radio ownership between developed and developing countries.

Additionally, a few countries perform better in the ICT domain than in their overall Index rankings. At 25th place overall, Russia, for example, ranks 13th in the ICT domain, with high access to electricity, mobile phone and internet access, youth dependence on the internet, higher numbers of digital natives. Brazil, too, ranks significantly higher in the ICT domain at 10th place, compared with its 15th place ranking overall, and performs above average in each of the five indicators.

Countries in the Middle East-North Africa (MENA) region also perform well in this domain compared to its overall Index performance. Saudi Arabia performs best among the MENA countries, while Egypt, Jordan, and Morocco also perform significantly better in the ICT domain than in their overall ranking of youth wellbeing, indicative of the MENA region’s burgeoning technology sector. Mexico and Nigeria, two other countries with growing technology sectors, also perform well in this domain.

Conversely, some upper middle income countries perform lower in the ICT domain than in their overall Index ranking. Thailand, for example, ranks significantly lower in ICT, at 19th place, than it does overall, at 10th place. While Thais have above average access to electricity, and youth indicate a slight dependence on the internet, there are fewer digital natives and households with radios, and mobile phone and internet access is lower. South Africa, another upper middle income country, also faces significant challenges in the ICT domain, scoring below the average in every indicator except household radios.

Perhaps unsurprisingly, lower income countries perform the worst in this domain. The 10 lowest performing countries are located in the Southeastern Asia and Sub-Saharan Africa region. Many lower income countries still face challenges in basic access to electricity, which heavily influences their performance across the other domain indicators.

A couple key conclusions

First, countries with greater economic resources and private sector investment have more supportive ICT infrastructure that enables them to perform better on indicators related to access to electricity, mobile phone and internet access, radio ownership, digital natives, and youths’ dependence on the internet. Perhaps unsurprisingly, youth in more advanced economies generally express greater reliance on the internet today. Japanese youth however indicate that the internet is less central in their lives than other top performers; and young Jordanians express above average dependence on the internet, though other indicators of access remain weaker.

Second, as we’ve highlighted in our other Index domain discussions, data remains limited, or nonexistent altogether, for a number of important ICT performance-based measurements. While there have been important contributions recently to the data body on certain elements of ICT usage among youth, such as International Telecommunications Union’s most recent (2013) Measuring the Information Society Report which included the digital native dataset on internet use, more data on youth and gender-disaggregated access to and use of other media and technology (such as mobile phones) could highlight opportunities for investment and partnerships to increase youths’ educational outcomes, civic participation, and economic opportunity. This, in turn, could promote more inclusive growth in both developing and developed economies.

As youth have said themselves in the Bynd 2015 Declaration, “Health, civic engagement, online protection, environmental protection and economic success all depend on having unfettered access to knowledge which ICTs can extend to everyone.” While investments and efforts must be made to bridge digital divides and mitigate their negative consequences or use, ICTs can be a powerful tool to improve education, health, and governance outcomes, and make training relevant in larger development initiatives in the Post-2015 era. You can explore the data and download the reports at www.youthindex.org.

Global Youth Wellbeing Index

Dr. Nicole Goldin is director of the Youth, Prosperity and Security Initiative at the Center for Strategic and International Studies (CSIS) in partnership with the International Youth Foundation (IYF). Follow her on Twitter @nicolegoldin.

In our modern times of media cycles fighting for our short attention spans, it is easy to ride the momentum of a highly visible campaign that can quickly fizzle out once another competing story emerges. Since the kidnappings of approximately 300 Nigerian girls by militant Islamist group Boko Haram last month, the international community has embraced the hashtag, “#BringBackOurGirls”, in a very vocal and visible social media campaign demanding action to rescue the Chibok girls. But one month since the mass kidnapping without the rescue of the girls, do we need to take a different approach? Will #BringBackOurGirls be just another campaign we forget about once the next celebrity scandal becomes breaking news?

#BringBackOurGirls goes global starting in Nigeria

Most of the #BringBackOurGirls campaign activity has been highly visible on Twitter, Facebook, and international media outlets. In this fascinating Twitter heat map created using the tool, CartoDB, featured in TIME Magazine, we can see a time-lapsed digital map of how the hashtag, “#BringBackOurGirls” spread globally, starting organically from within Nigeria in mid April.

(We’ll be touching upon CartoDB, and other digital mapping tools in our upcoming Mapping for International Development course later this month.)

The #BringBackOurGirls hashtag has been embraced widely by many public figures and has garnered wide support across the world. Michelle Obama, David Cameron, and Malala Yusafzai have posted images with the hashtag, along with celebrities such as Ellen Degeneres, Angelina Jolie, and Dwayne Johnson. To date, nearly 1 million people signed the Change.org petition. Countries including the USA, UK, China, Israel have pledged to join the rescue efforts, and other human rights campaigns have joined the #BringBackOurGirls Twitter momentum, as seen on this Hashtagify map.

hashtagify #BringBackOurGirls

Is #BringBackOurGirls repeating the mistakes of #KONY2012?

Kony_2012_Poster_3

A great example of a past campaign where this happened was with the KONY2012 campaign, which brought some albeit short-lived urgency to addressing the child soldiers recruited by Joseph Kony, leader of the Lord’s Resistance Army (LRA). Michael Poffenberger, who worked on that campaign, will join us a guest expert in TC110: Social Media for Social Change online course in June 2013 and compare it the current #BringBackOurGirls campaign. Many have drawn parallels to both campaigns and warned of the false optimism that hyped social media messages can bring when context is not fully considered and understood.

According to Lauren Wolfe of Foreign Policy magazine, “Understanding what has happened to the Nigerian girls and how to rescue them means beginning to face what has happened to hundreds of thousands, if not millions, of girls over years in global armed conflict.” To some critics, this hashtag trivializes the weaknesses of Nigerian democracy that have been exposed. Critics of using social media in advocacy campaigns have used the term “slacktivism” to describe the passive, minimal effort needed to participate in these movements. Others have cited such media waves being exploited for individual gain, as opposed to genuinely benefiting the girls. Florida State University Political Science professor, Will H. Moore, argues that this hashtag activism is not only hurting the larger cause of rescuing the kidnapped girls, but actually helping Boko Haram. Jumoke Balogun, Co-Founder of CompareAfrique, also highlights the limits of the #BringBackOurGirls hashtag impact.

Hashtag activism, alone, is not enough

With all this social media activity and international press, what actual progress has been made in rescuing the kidnapped girls? If the objective is raising awareness of the issue, yes, the hashtag has been successful. If the objective is to rescue the girls, we still have a long way to go, even if the hashtag campaign has been part of a multi-pronged approach to galvanize resources into action.

The bottom line: social media can be a powerful tool to bring visibility and awareness to a cause, but a hashtag alone is not enough to bring about social change. There are a myriad of resources that must be coordinated to effectively implement this rescue mission, which will only become more difficult as more time passes. However, prioritizing and shining a sustained light on the problem, instead getting distracted by competing media cycles on celebrities getting into petty fights, is the first step toward a solution.

===

What do you think about the impact of the #BringBackOurGirls campaign? We’re only scratching the surface here on the topic of social media for social change and invite you continue the discussion with us in our upcoming Social Media for Social Change online course which runs June 16 – July 11, 2014.