The Global Database of Events, Language and Tone (GDELT) has been gathering and databasing all the news events related to conflict and political protest dating back to 1979. GDELT continues to be fed new data through the various global news services, automatically updating every day. At the end of July GDELT released their Global Dashboard which visualizes all of their data collected from February 2014 to present on a map of the world. It’s a fantastic tool for conflict management and resolution professionals who are interested in big data, since it takes their information and puts it in a visually attractive, easily navigable format. This is an exciting development, so how does it work and what can peacebuilding practitioners get out of using GDELT’s event data?

The first thing to keep in mind is that the Dashboard is new. As it stands there are only two filters for event data (‘conflict’ or ‘protest’), but there are plans to expand these filters so that users can easily focus on the events that are of most interest. For now they’ve done a pretty good job of helping filter out conflict events, which are basically events involving kinetic violence, from protest events, which could end up being violent but are generally more along the lines of protests and social action. While basic, these are good starting points for an initial filter. The nice thing about the dashboard though is that if I have some expertise about the region or event I’m interested in gathering data on, I don’t need the filters because I can use geography and date to narrow my search. The Dashboard allows the user to take advantage of their contextual knowledge to filter the data, so while the built-in filters that come later will be helpful researchers can still use the database efficiently now.

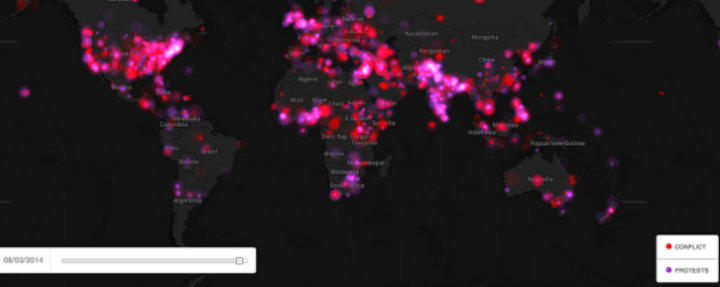
Let’s say we’re interested in recent protest events in South Africa, but we want to know if there have been any in smaller cities, since we know that there’s likely to be a lot of political action in places like Cape Town and Johannesburg. I started with the Dashboard zoomed out to the maximum, so I could see the whole world, then went to the bottom left and set the date that I was interested in seeing news from. For this test I picked August 3, 2014. Below is what the screen looked like at this point:

GDELT Global Dashboard

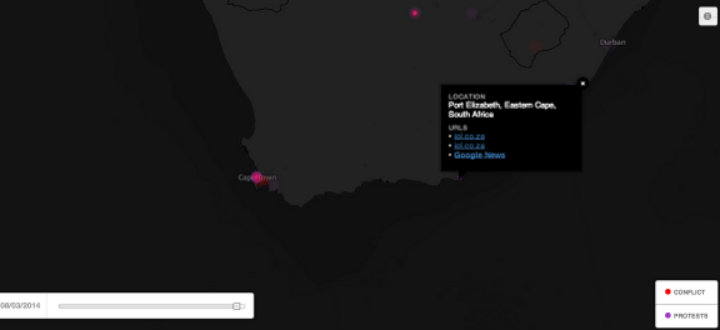
We can see the whole world, and in South Africa there are big dots indicating aggregated data. Since I want to see what’s happened outside the main cities, I zoomed in until the dots started to disaggregate, then I selected the ‘protest’ filter to remove the ‘conflict’ events. Once I was zoomed in the filter was set, I found that there was a protest event in Port Elizabeth so I clicked on the dot and a box with the web addresses for news articles about a protest against money being spent on a museum appeared: GDELT Global Dashboard: South Africa
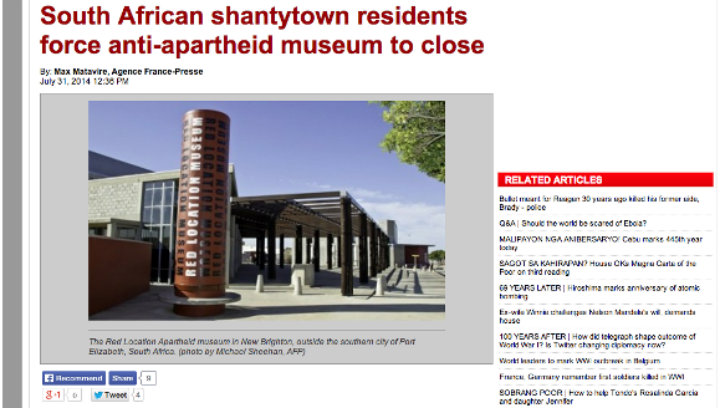
I clicked on the Google News link, which took me to the related articles that Google had collected about that protest and read one that had been reposted by a local news service from the Agence France-Presse:

"South African shantytowns residents force anti-apartheid museum to close," Agence France-Presse

I managed to do this in a few minutes using the Dashboard, work that would have taken longer if I was just doing searches for protest news out of South Africa. What makes the tool really useful is that I can search in a few different dimensions. If want to know if this is the first time there has been social action around the museum in Port Elizabeth, I can leave the map zoomed in to that location and scan through the dates going back to February. What we can do, relatively easily, is see events and narratives spatially and analyze how they change over time.

This is a big dataset, so I thought hard about what its value added is from a methodology perspective. As I dug through the data, I realized something important. I’m not sure this is a database that will be particularly useful for forecasting or predictive analysis. You might be able to identify some trends (and that’s certainly a valid task!), but since the data itself is news reports there’s going to be a lot of variation across tone and word choice, lag between event and publication, and a whole host of other things that will make predictive analysis difficult.

As a qualitative dataset though, the GDELT data has incredible value. A colleague of mine pointed out that the Dashboard can help us understand how the media conceptualizes and broadcasts violence at the local level. Understanding how news media, especially local media, report things like risk or political issues is valuable for conflict analysts and peacebuilding professionals. I would argue that this is actually more valuable than forecasting or predictive modeling; if we understand at a deeper level why people would turn to violence, and how the local media narrative distills or diffuses their perception of risk or grievance, then interventions such as negotiation, mediation and political settlements can be better tailored to the local context.

Big Data is a space that is both alluring and enigmatic for conflict resolution professionals. One of the key challenges has always been making the data available in a way that is intuitive for non-technical experts to use. GDELT’s Dashboard is a great start to this, and the possibilities for improving our understanding of conflict through the narratives we can observe in the media are going to grow rapidly in the next few years.

This post originally appeared in Insight for Conflict on September 19, 2014. 


Spreading violence in South Sudan threatens thousands of civilian lives, political stability in the region, and even outbreaks of transmissible disease (NYT). As the fog of the initial outbreak of war begins to clear, the question becomes how the international community should begin to address this hot conflict, and prepare for what is likely to be a global humanitarian response effort. Student networks such as STAND are writing open memorandums to policymakers, while volunteer technical communities such as contributors to The Enough Project and the Satellite Sentinel Project (SSP) are sending their pleas straight to the media. But as we move from advocacy to response, a number of core questions come to mind:

  • Who are the key actors?
  • What are their motivations?
  • What are our windows of opportunity to see a reduction in violence?

And as these questions get answered – how do organizations ensure that their work is complementary?

Coordinating the Information Flow

With information flows from the region taking the form of emails, phone calls, text messages, and videos from people’s mobile phones, connecting the dots is the entire point of organizations such as the Digital Humanitarian Network (DHNet), whose activation TechChange was proud to be part of last year, and reliefweb.int – a well known asset for first responders. But because South Sudan is still in the midst of a hot conflict, actors coordinating with one another must take into consideration the lives of individuals who are still in the region to ensure that no additional harm is done through the sharing of this information.

The good news is that there are guidelines for such a response effort, not least from what has been provided by the lessons from the Libya Crisis Map by OCHA, who are also keeping tabs on the current crisis (see image below). Andrej Verity, an Information Management Officer at UN-OCHA identified three specific ethical issues in Libya:

1. Identify. We did not want any information provided in the LCM that could be used to identify the individual who reported.

2. Location. To avoid anyone from being able to pinpoint anyone reporting, the data was generally anonymized to the centroid of the city it was reported from.

3. Do No Harm. Given the situation in Libya was conflict-based, we needed to ensure that whatever we did minimized the chance of causing anyone harm.

Sudan: Humanitarian Snapshot (30 September 2013) [UN-OCHA]

Connecting Grassroots to Government: South Sudan Watch

Connecting grassroots volunteer networks to government response is not an easy task, as our partners at the Wilson Center have explored these challenges in depth. Moreover, their recent workshop report lists “[f]actors obstructing the adoption of crowdsourcing, social media, and digital volunteerism approaches often include uncertainty about accuracy, fear of liability, inability to translate research into operational decision-making, and policy limitations on gathering and managing data.”

These are not small challenges, but one recent effort deserves recognition: A recent Ushahidi deployment for South Sudan Watch. According to the About page, it is designed to be just such a centralized reporting mechanism for watchers of the current conflict in South Sudan. Also worth noting, is that the entry forms have been modified to aid in conflict analysis, and the public information restricted to protect those on the ground and report contributors.

Will it make a difference? Maybe. Rob Baker of Ushahidi (and until recently a Presidential Innovation Fellow) shared with us:

“It won’t be easy, but we believe it is necessary to try. We can learn from past examples to help on the ground — nobody is here to just make a map, but hopefully to improve the situation on the ground through a better understanding of what is happening through technology and crowdsourcing.”

If you are interested in learning more, please do check out the live Ushahidi deployment and see how you can contribute. We’ll continue to add more information as it becomes available.

South Sudan Watch: http://southsudanwatch.ushahidi.com/

Want to learn more about how digital mapping and other technology like social media and and mobile phones are addressing conflicts around the world? Enroll now in TC109: Technology for Conflict Management and Peacebuilding, which starts January 13, 2014.

This past weekend Dr. Michael Gibbons and I taught a 20-hour graduate skills institute at American University’s School of International Service entitled Applications of Technology for Peacebuilding. Students came from a variety of AU programs, including the International Peace and Conflict Program (IPCR) in the School of International Service, the AU Business School, and the AU Law School.

We at TechChange were especially excited about this course, as it allowed us an opportunity to incorporate a variety of new tech-based tools in the curriculum, both those created by TechChange and others. The inclusion of these tools was designed to foster collaboration, allow for course materials to be accessed in innovative, non-linear ways, and to give students an opportunity to participate in hands-on simulations using some of the same tools (e.g. Ushahidi) currently being used by practitioners in the field.

(more…)