Let’s pick up where we left off in Part 1 of our survey design for quality data series, which was inspired by Dobility founder and CEO Dr. Christopher Robert’s presentation in the TechChange course “Technology for Data Collection and Survey Design.” Lesson 1 focused on designing your survey with empathy for field staff and respondents. Lesson 2 highlighted SurveyCTO tools for building in relevance and constraints. With Lesson 3, we’ll jump into a number of ways that SurveyCTO enables you to automate monitoring and workflow.
Lesson 3: Automate Monitoring and Workflow
The staffing structure for a typical survey might look something like this: a research team designs a survey. Thousands of miles away, a field team conducts the surveys. The collected data then goes back to the research team for analysis.
The research team wants to be able to monitor the field team and audit their work throughout the process. Supervisors on the field team may also want to monitor their enumerators. And, just to get complicated, the research team may also hire a survey firm to conduct the survey themselves or to provide an additional layer of monitoring for the field team.
In the case of traditional paper surveys, quality checks might include:
- a member of the research team accompanies enumerators in the field
- a supervisor reviews surveys as they come in
- an independent team conducts “back-checks” after initial surveys are completed, to corroborate the results
Many of the quality checks available when conducting a paper survey occur AFTER the initial surveying is complete. You may not know you have bad data until it’s too costly – and too late – to do anything about it.
One of the most compelling opportunities afforded by SurveyCTO is the ability to easily program a number of quality checks into your survey that can automatically flag issues as they arise. Not only that, with a little extra work up-front, you can prep your data to make the transition to visualization and analysis even faster.
Example 1: Audio audits and speed limits
Back-checks are time-consuming and expensive, so why not listen in from the office? You can program your SurveyCTO surveys to randomly capture audio throughout an interview.
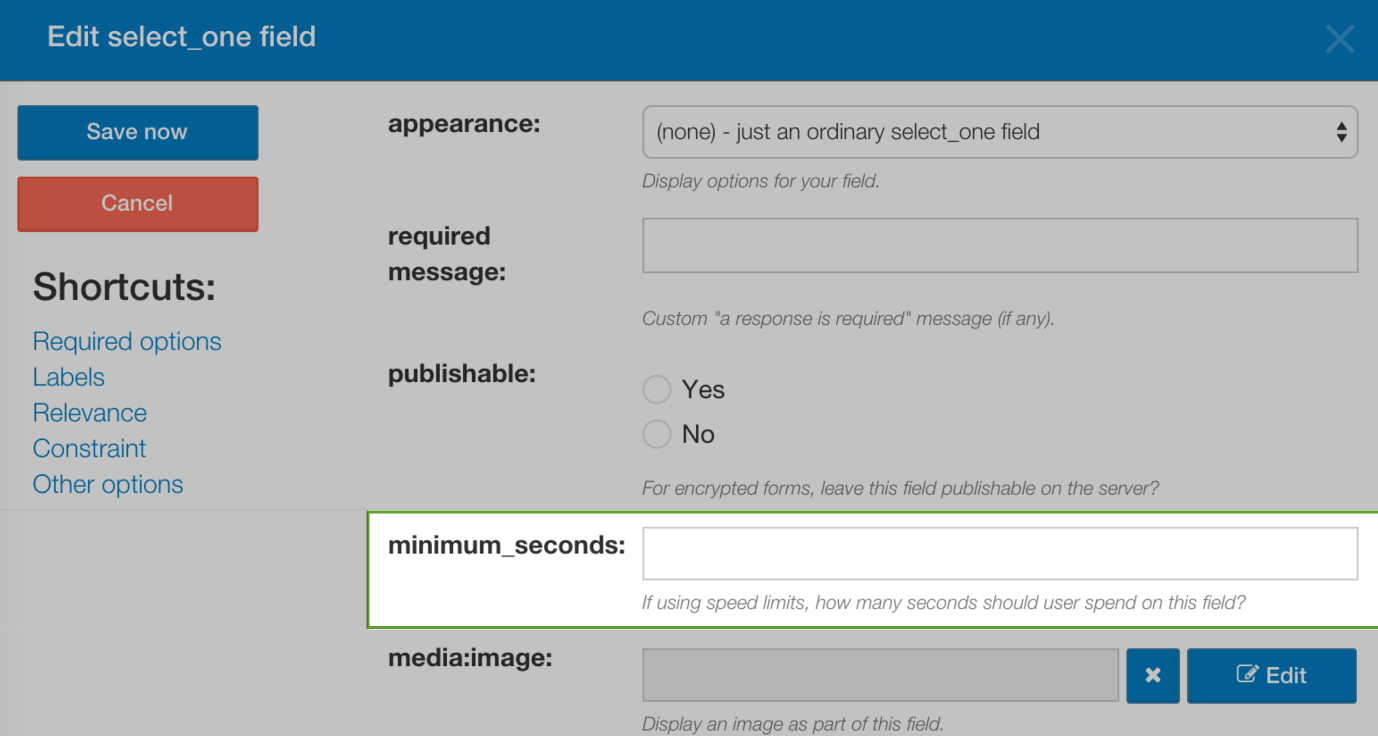
Or, even better, pair audio audits with “speed limits,” which allow you to indicate the minimum time that a particular question should take to ask and answer properly. For example, you can program your survey to automatically start recording after the enumerator violates three speed limits – meaning they didn’t take enough time on three different questions within the same survey.
Since audio audits and speed limits are programmed by the research team, the field team won’t know the specifics – they’ll just know that there’s an additional layer of accountability.
Sample speed limit:
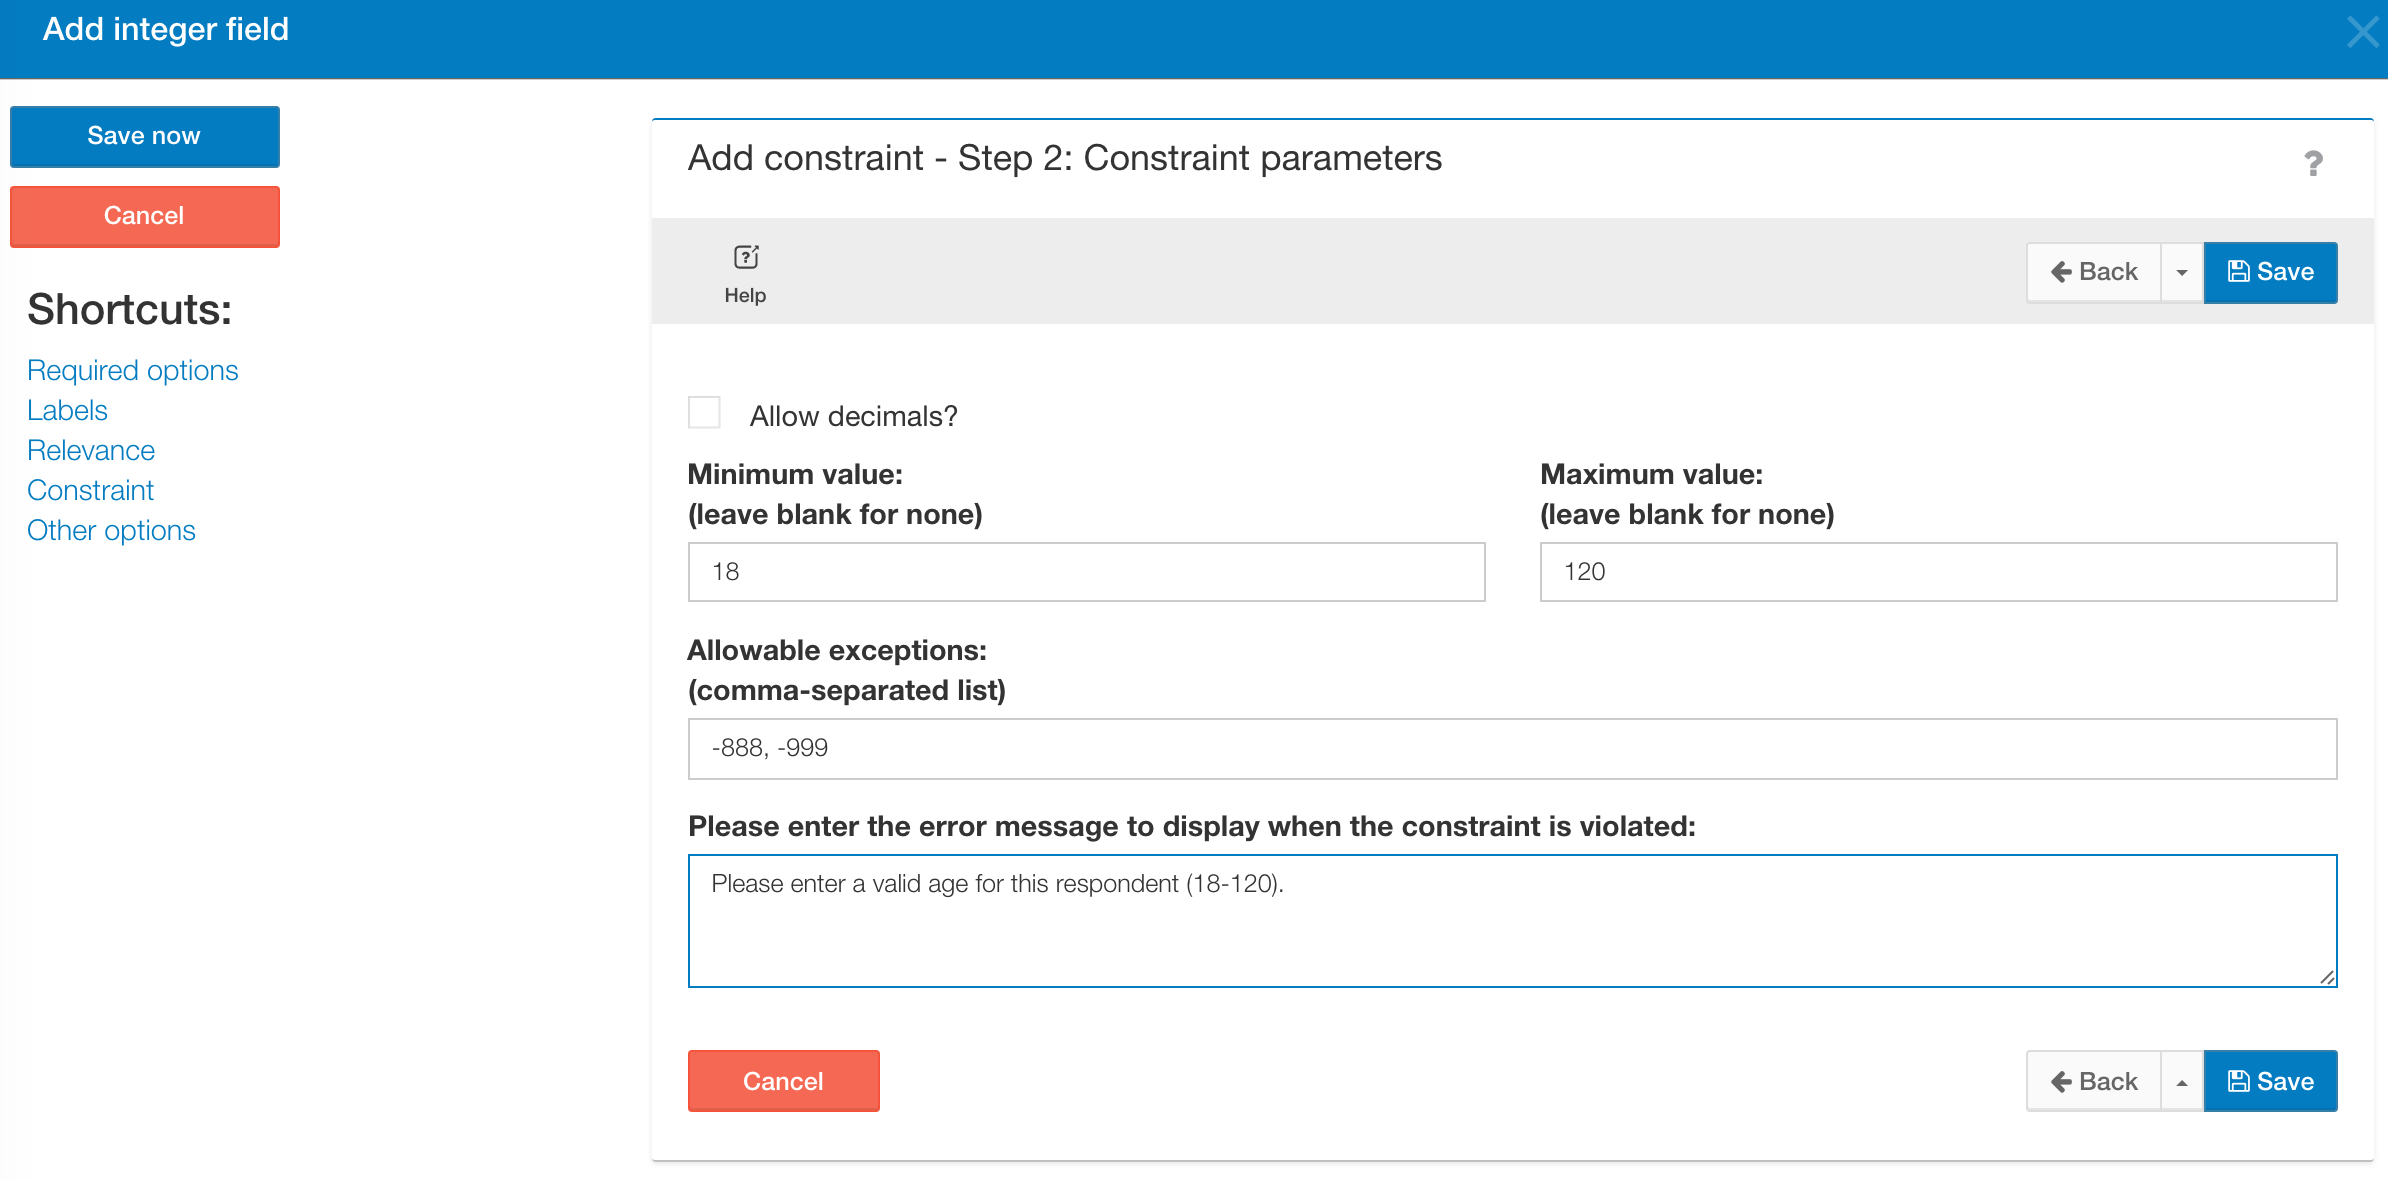
Example 2: Automated checks
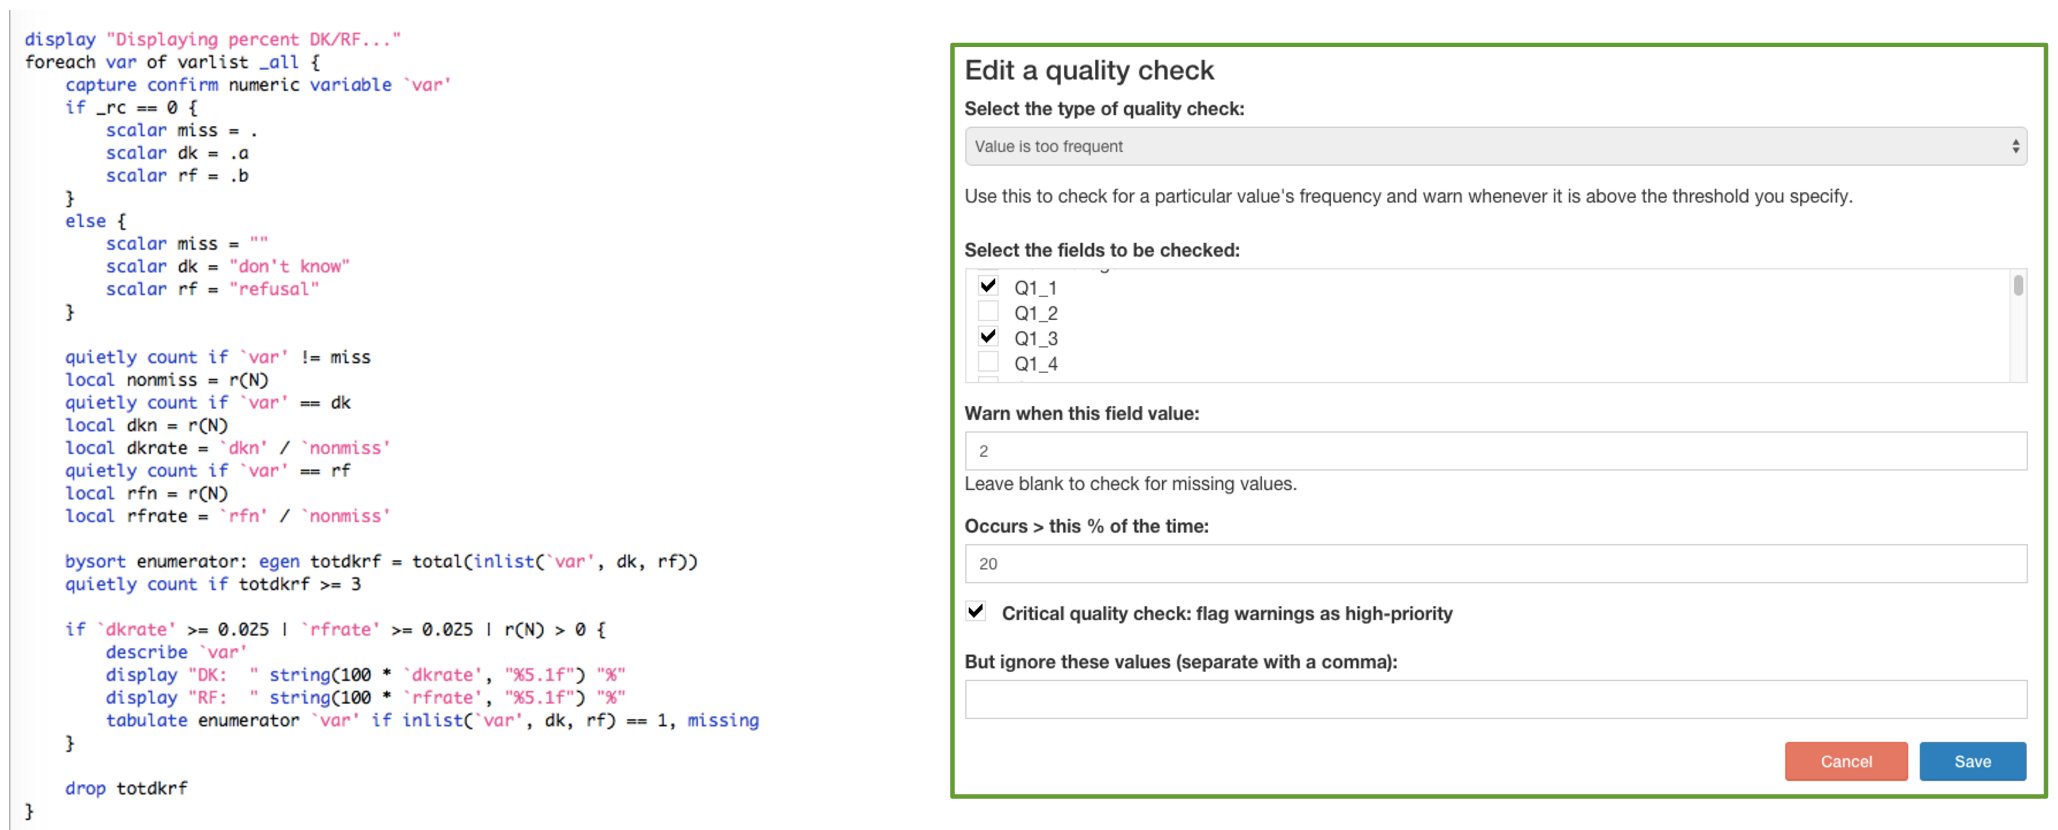
Our most sophisticated users write quality checks in Stata code, to automatically flag data that doesn’t behave as expected. But we wanted to ensure this best practice is available to all of our users, which is why we’ve built the feature into SurveyCTO.
Spend a few minutes during the survey design phase to set up at least one automated check and you’ll not only be able to identify and address issues right when they arise, you’ll have more reliable data to work with once your surveying is complete.
Sample automated check:
Example 3: Concatenate and calculate
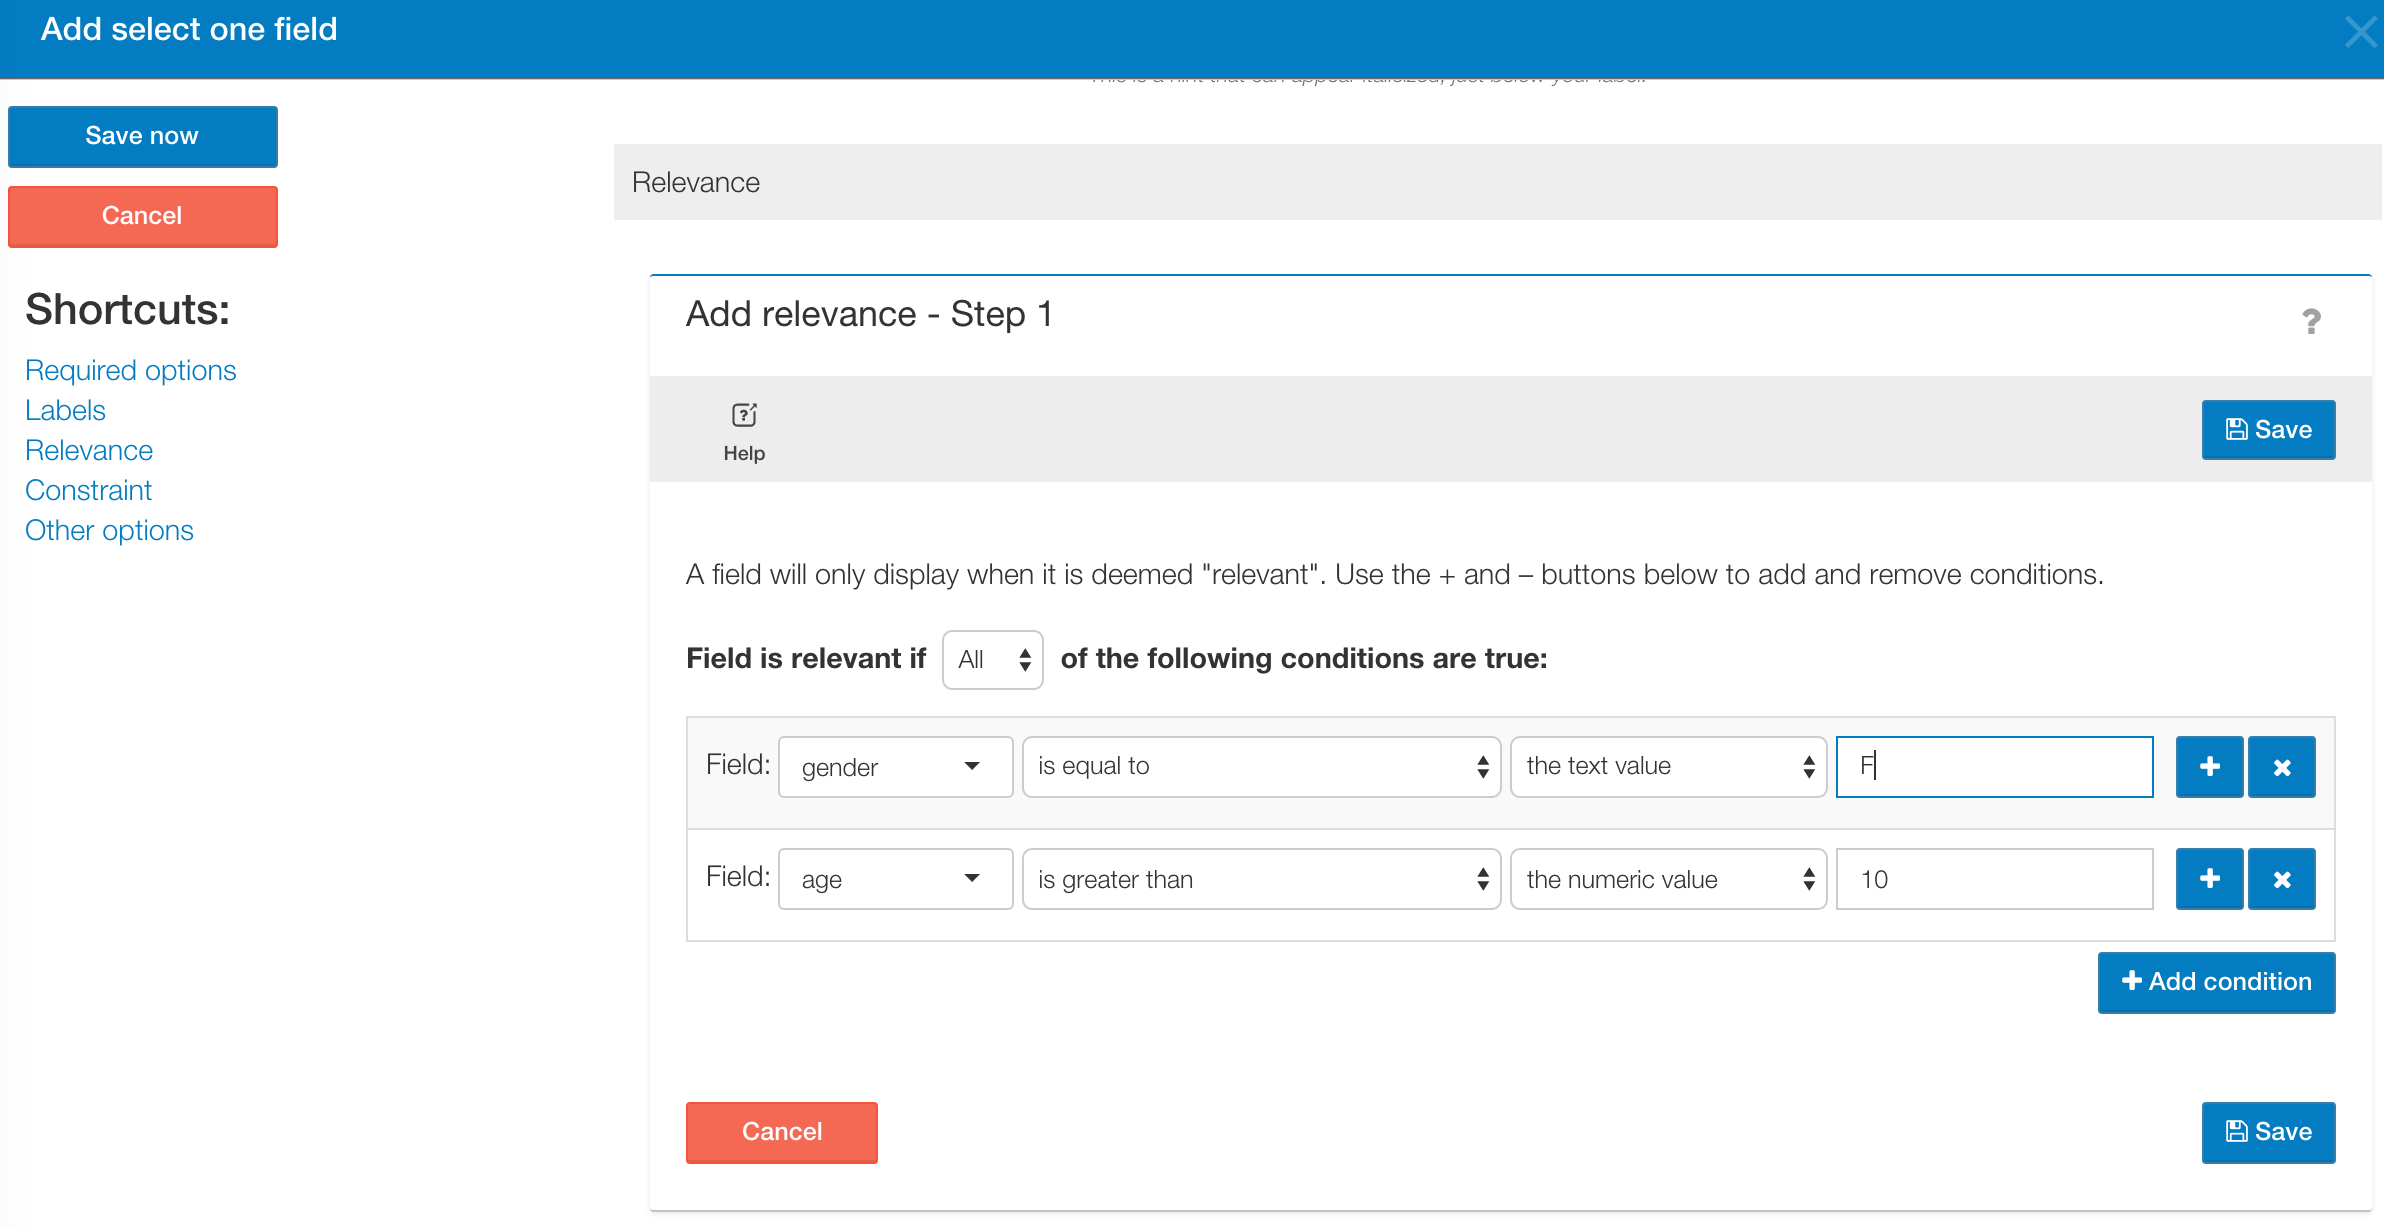
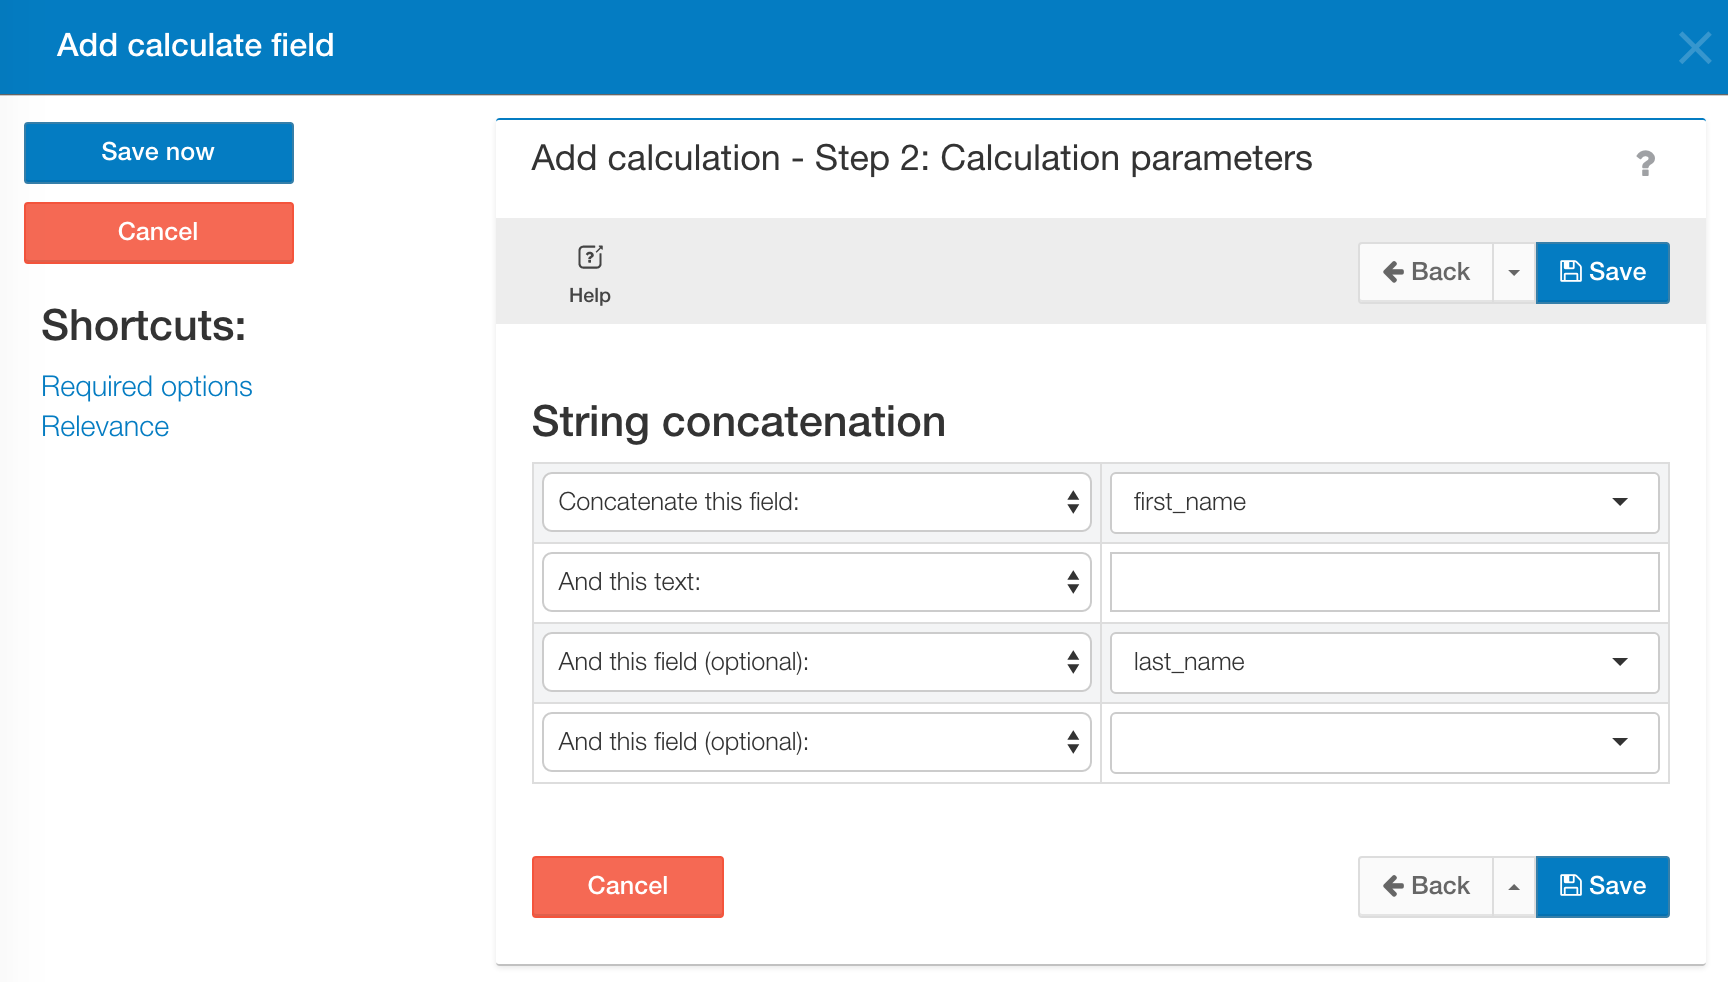
Let’s say your survey splits first name and last time into two fields but you would prefer it displays in one field during the analysis stage. You can easily program the form builder to concatenate – or link fields together – so that when you output the data, it’s already formatted the way you want it. You can also set up automated calculations, which can help with analysis or serve as a useful relevance trigger during the survey itself.
Sample calculation:
Example 4: Visualize and analyze
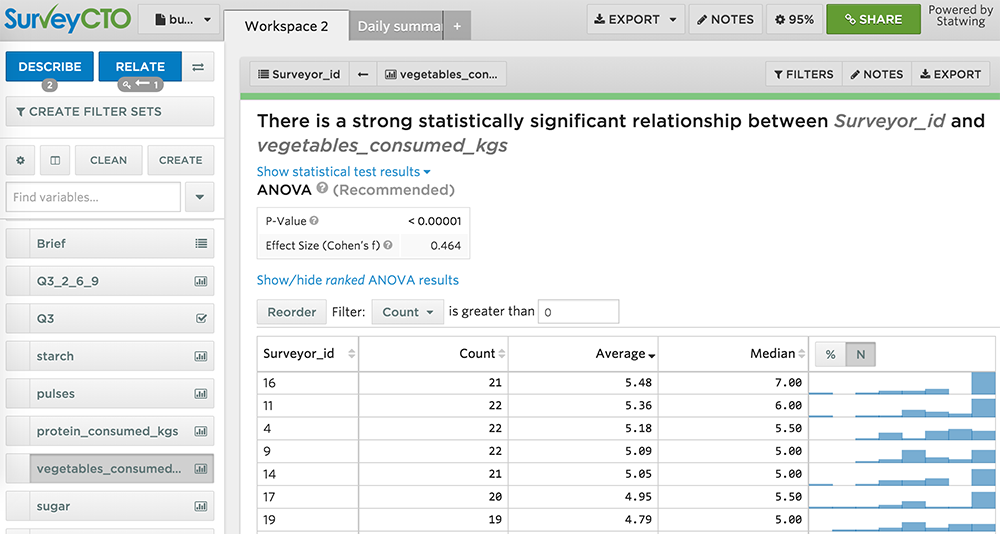
As soon as your data is uploaded, you can take advantage of our integrations with Statwing, Google Sheets, Google Earth, Stata, Excel, and Salesforce (via OpenFn.org), or export it to JSON or CSV file formats and start analyzing it in the platform of your choice.
Using a mobile data collection platform enables you to skip the laborious and error-ridden step of data-entry. Instead of spending months entering, checking, and rechecking the data you collected – not to mention storing hundreds (or thousands!) of survey booklets – start analyzing your data the day it’s collected.
Sample integration with Statwing:
Final Thoughts
Just remember that even experienced survey designers struggle at times with developing the best structure for exploring a research question and setting up the systems to minimize the risk of collecting bad data. Hopefully this series on survey design for quality data has given you some ideas for how to approach your next project. And if there are any additional topics you’d like us to cover, please leave them in the comments.
Read Part 1 of the series here. This article was originally published on the SurveyCTO blog.
About Alexis
Alexis Ditkowsky is the community and business strategy lead for Dobility, the company behind SurveyCTO. Her experience spans social entrepreneurship,