On Monday, we had the pleasure of hosting TechGirls’s Job Shadow Day for the fourth year in a row! TechGirls is a selective exchange program that encourages and supports the desire of Middle Eastern and North African teenage girls to pursue careers in science, technology, engineering, and math (STEM). During the 3 week long exchange program, the girls (ranging from ages 15 – 17) travel around the U.S. getting a taste of the various careers one can have in STEM. One of the ways they experience a STEM career in the U.S. is by spending a day at a tech company during Job Shadow Day.

We were lucky enough to host Nada Abdelaziz Mostafa Abdelaziz and Lydia Ferial Oukid, who have interests in bioengineering and biomedical engineering, this year at our DC office. Both hope to learn more about the technology and engineering fields, and aspire to be leaders in both their local and international communities. We were able to show them a bit about what we do here at TechChange, and hosted workshops with our creative, industrial design, tech, and communication teams.

Nada and Lydia began their day by working with our creative team to create their own animated assets!

1-P1290763

Check out what they created below:

techgirls


Afterwards, they were able to learn about the projects that our tech fellows have been working on this summer.

13725075_1134173716620722_2646037764774323173_o

As per TechChange tradition, we had lunch at a nearby Ethiopian restaurant.

After lunch, Lydia and Nadia worked with our instructional design team, and were able to create their own online course in Articulate! Check out Lydia’s articulate and Nada’s articulate.

Lastly, they learned how to build their own webpage in HTML, with the assets they created throughout the day, from our tech team!

13730978_1134174156620678_8712223867692955037_o

All around, we at TechChange had a great time with the TechGirls! We look forward to hearing more of their future accomplishments — best of luck Nada and Lydia!

13735780_1134174609953966_521051255139547189_o

Last week, the mobile data collection service Magpi released its latest addition to the platform: data visualizations. We sat down with the founder and CEO, Dr. Joel Selanikio, to talk about the new feature and what Magpi has in store for the future.

Magpi  prides itself in taking the programming out of data collection tasks. As a medical doctor concerned with global health, Selanikio is always looking for ways to add more user-friendly features. He would ask himself, “Wow, we keep taking these things that require programming and taking out all the programming. What else is there we can do?”

The obvious answer was to add an intuitive data visualization layer to Magpi, so that users could easily access, understand, and communicate the data they were collecting.

“Before, we thought that if users wanted to visualize the data, we can just let them export the data and enter it into Microsoft Excel. What we didn’t realize was how time consuming a process this can be for our users, so our new release will allow users to generate beautiful reports instantly,” said Selanikio.

For the past year, the programmers at Magpi have been working hard to make user-modifiable data visualizations which can be easily embedded and shared. Some sample outputs from the new data visualization system are shown below –  these graphs can be automatically generated whenever a user creates a report from their data.

Screen Shot 2016-07-19 at 3.05.51 PM

“I am super excited to show this to people,” said Selanikio. Users familiar with HTML can also further customize the visualizations, and magpi will be adding more data visualization features based on user feedback.

“We’re making it so that if you’re using Google Sheets, you can add triggers so you can enter data in a Google Sheet and it will automatically update your Magpi report.”

Screen Shot 2016-07-19 at 3.05.36 PM


In the future, Magpi is hoping to add features such as video, the ability to read barcodes, and more! Stay tuned for more exciting updates to come!

Next Tuesday, July 26, from 11:00 AM to 12:00 PM EDT, Magpi will be hosting a free webinar on how to use the new reports feature: click here to register.

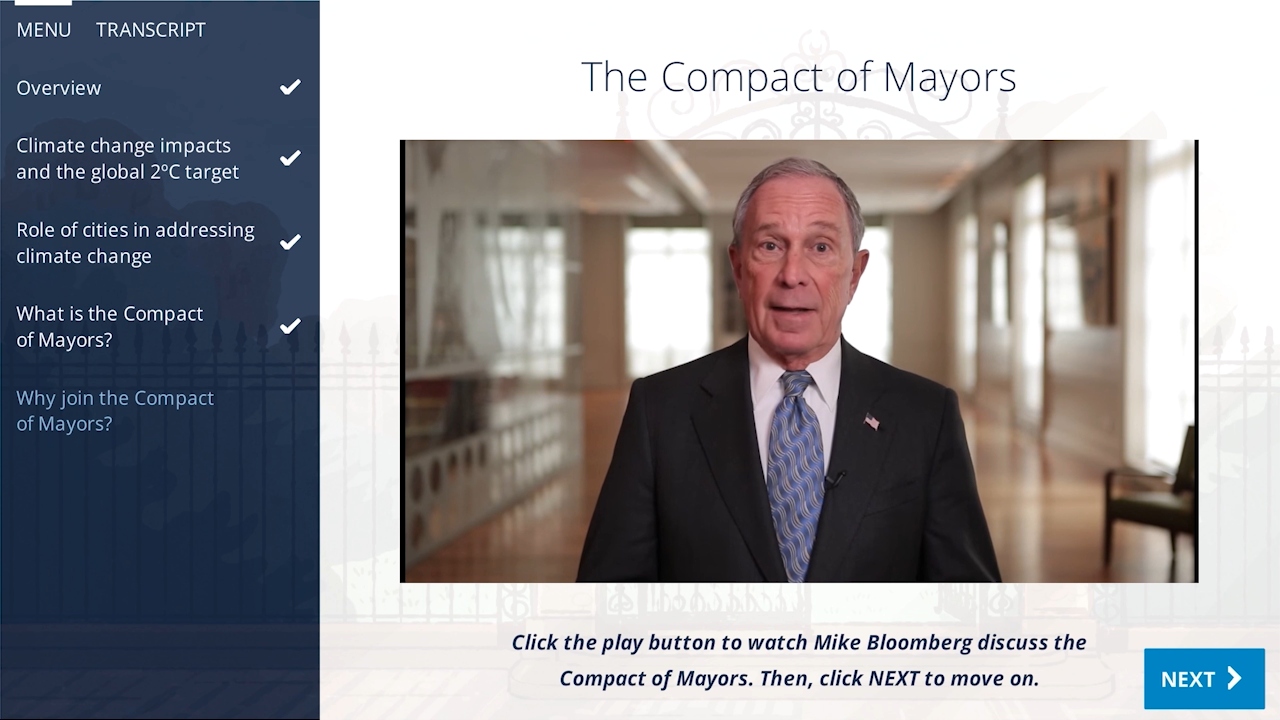
In partnership with the World Resources Institute, TechChange has built a seven-module online course for the Compact of Mayors, a global coalition of mayors and city leaders committed to sustainable local climate action. By providing a standard, public method of reporting emissions and efforts, the Compact aims to capture and accelerate impact. To announce the course, TechChange produced an animation that was presented at the 2015 United Nations Climate Change Conference in Paris.

A frame from the TechChange animation shown at the 2015 United Nations Climate Change Conference in Paris.

The animation shown in Paris was a compilation of scenes from seven other animations, each developed to capture the key takeaways from one of the seven modules. Designed for a broad audience of mayors, city sustainability officers, and environmental policy advisors from all over the globe, each animation provides a quick overview of a module for learners seeking a basic understanding of the Compact of Mayors.

Diving deeper with interactive content

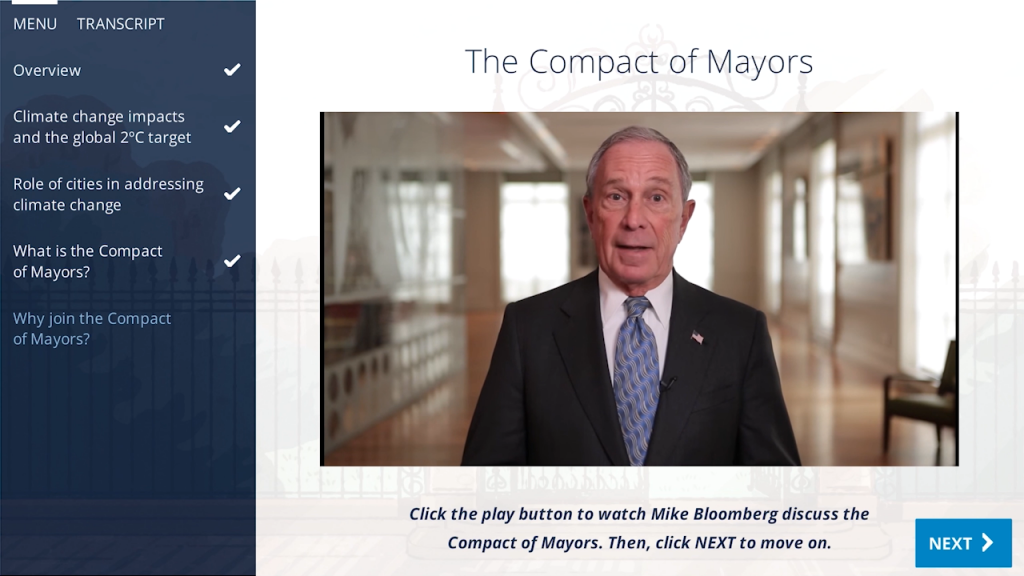
For those interested in a more in-depth understanding, TechChange developed interactive exercises, infographics, maps, graphs, and resources for each of the seven modules. Coupled with videos, avatars, backgrounds, and narration, these ten to thirty minute “deep dive” modules walk the learner through what the Compact is, how a city can become Compact-compliant, and why a city would benefit from becoming Compact-compliant.

A screenshot from Module 1: Introduction to the Compact of Mayors.

In total, the course takes 3 hours to complete, or longer if the learner chooses to explore the numerous resources provided throughout. In order to retain learner engagement with course material, TechChange employed three main instructional design strategies: epic learning goals, flexible learning paths, and frequent opportunities to apply material through practice exercises with instant feedback.

1. Epic learning goals

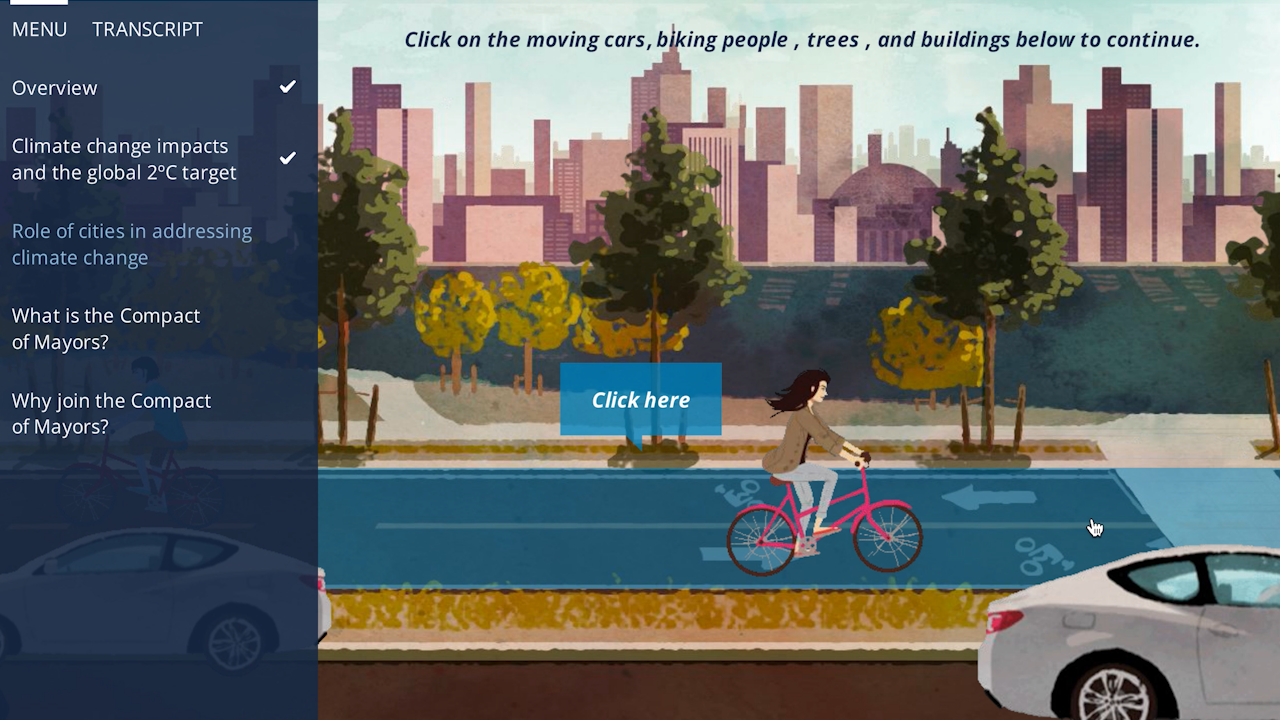
In order to visually reflect the course’s epic goal of empowering city leaders to make a difference in the climate trajectory of their city, TechChange designed each module to take place in a specific part of a virtual city. As the learner progresses through the course, the city becomes visibly improved; each module’s location becoming more vibrant while trees, flowers, and wildlife begin to appear. The visibly improving virtual city, displayed at the beginning and end of each module, provides a subtle reminder to learners that their efforts to complete each module reflect a much larger local effort to improve real cities on a global scale.

2. Flexible learning paths

Providing nonlinear learning paths allows learners to structure their own learning experience. For example, to learn more about the role of cities in combatting climate change, the course invites the learner to click parts of a city scene. Every time the learner completes a section, the learner is invited to pick the next section that piques their interest.

A screenshot from Module 1: Introduction to the Compact of Mayors.

3. Real-time feedback

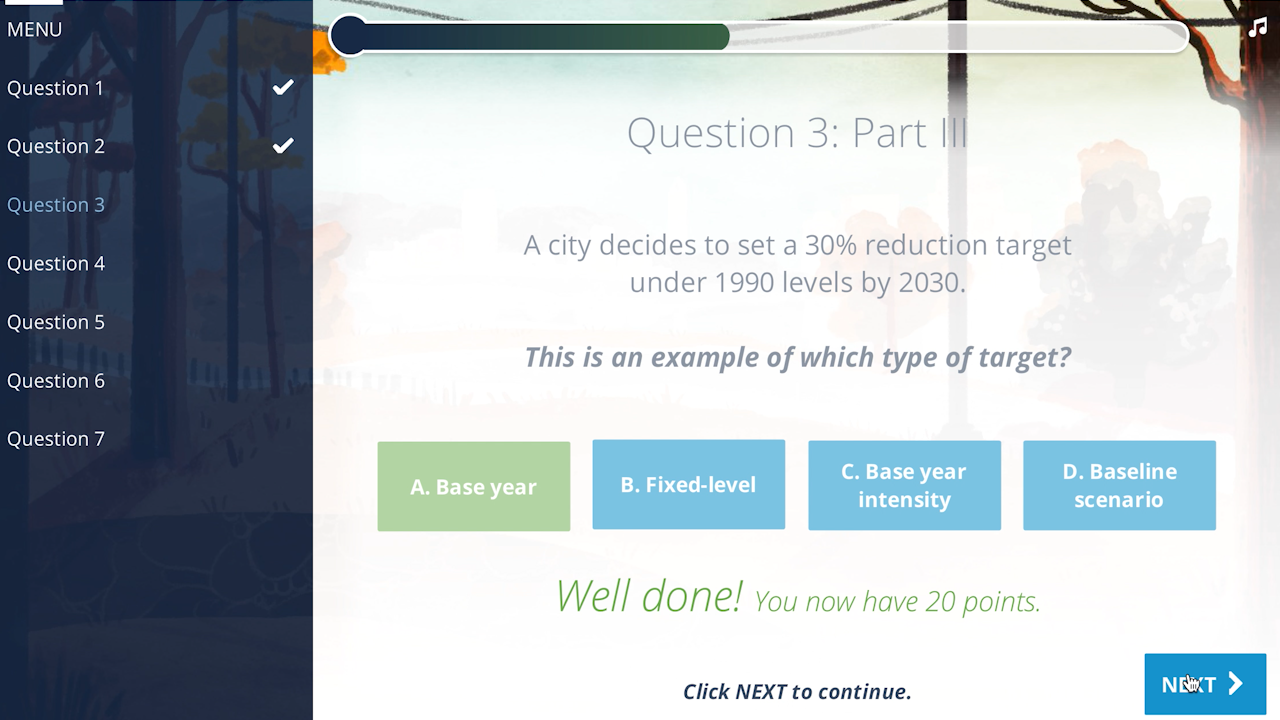
In addition to emphasizing the epic nature of the learning goals and empowering learners to customize their learning paths, the course aims to capture learner attention by providing ample opportunities for learners to apply material through practice exercises with real-time feedback. In a knowledge assessment included in Module 5, the learner receives a certain number of points based on how many attempts it takes them to get the correct answer and how many options the question contained. A scoring meter provides a visualization of the learner’s cumulative score. Coupled with some simple sound effects, it’s a basic but effective mechanism that results in the learner’s effort directly impacting their visual and auditory experience, and hopefully motivating them to try again or keep going.

A screenshot from the knowledge assessment included in Module 5: Setting GHG Reduction Targets.

Putting strategy to the test

In order to test the effectiveness of these strategies in the Compact of Mayors course, TechChange will be tracking and analyzing virtually every click a learner makes while taking this course. Do learners actually go through content in unique ways, or do most follow suggested learning paths? Do learners who failed several times during practice exercises persevere or is the feedback mechanism not enough to inspire completion? Being able to answer those types of questions will not only help TechChange improve this course over time but also inform how TechChange can most effectively design new courses in other topic areas in the future. To try the course yourself, register for an account at compactofmayors.course.tc/learn.