TechChange courses are designed for busy young professionals. In any of our courses, you will find yourself taking the course alongside international development field and headquarter staff, university professors and students, freelancers, and so many other kinds of eager learners. Today, we are excited to chat with Eva Erlach, who is a full-time law student in Vienna, Austria and also works part-time for Ground Truth Solutions. Eva recently took our Technology for Data Visualization course. We caught up with her to see how she was able to apply what she learned in the course.
How did you come across the TechChange course?
At Ground Truth Solutions, I am regularly tasked with producing reports on the perceptions of crisis-affected people during humanitarian actions. In order to visualize the data, I was looking around for the best resources to learn more about data visualization. I came across TechChange’s Tech for Data Visualization course on Twitter and my employer helped me pay for the course.
Have you taken online courses before? What did you think of the TechChange course?
This was actually my first online course and I was very impressed. The ability to interact with other participants in the course was great! Also, since the live events with guest experts were always recorded, and I could revisit the course materials for four more months, it really gave me flexibility to manage my time to make the most out of the course. There were a lot of resources — which is always better than having less — and that gave me freedom to either just get an overview of the topic or dig deeper on the topics most useful to me.
Are you new to data visualization?
I have actually been doing data visualization for a while, and mainly on Excel. I also knew of the other data visualization tools but wasn’t sure which ones were good ones and how to really work with them. This course gave me the insights I needed on different data visualization tools. It also helped me see that you can do much more data visualization just with Excel. Most of the other data visualization software tend to be expensive, so learning more about data visualization on Excel was great.
How did you use what you learned in the course at Ground Truth Solutions?
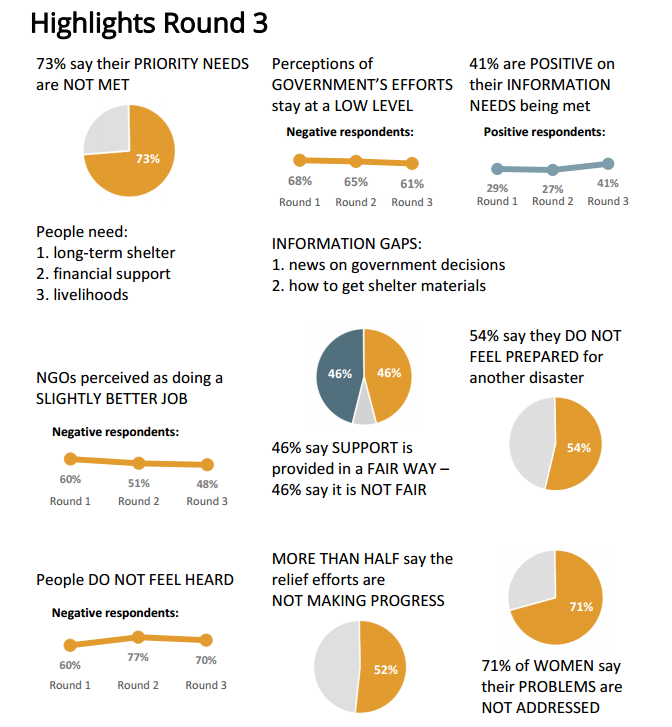
I worked on Ground Truth Solutions’ three reports on community perceptions in the Nepal crisis. As part of the Inter-Agency Community Feedback Project, Ground Truth’s role is to provide the government of Nepal and aid agencies with real-time feedback from affected people and recommendations based on that feedback.
Our audience for this report were agencies involved in the humanitarian response in Nepal. Since the agencies wanted to be able to print and disseminate the reports to field staff as well as email to their branch offices, we decided to do a pdf report instead of an interactive dashboard. I used R for the analysis and created the graphs on Excel. I then created the maps on Inkscape, and used a python script for the labels and colors.
I was able to visualize the data in a better way because of the course. The reports are available on our website to download and we have been promoting it all over social media.
How has the course been useful to you?
The course really allowed me to understand data visualization on a deeper level, and to realize that we really need to think about the audience for any visualizations you work on and the kind of message you are trying to communicate through the visualization.
Would you recommend this course to a friend or colleague?
Absolutely!
Interested in learning more about how to use technology for your organization’s data visualization needs? We start our next Technology for Data Visualization online course on Monday, November 23! Join participants like Eva in this four-week online course!
About Eva

Eva Erlach is a program analyst at Ground Truth Solutions. The aim of Ground Truth is to support humanitarian actors to systematically listen and respond to the voices of affected people. Eva holds an undergraduate degree in Development Studies and is currently finishing her law degree at University of Vienna, specializing in human rights. She has volunteered on social projects in India and Uganda and has experience in the field of asylum law and domestic violence.


