Why Public Health is a Geographic Issue
|
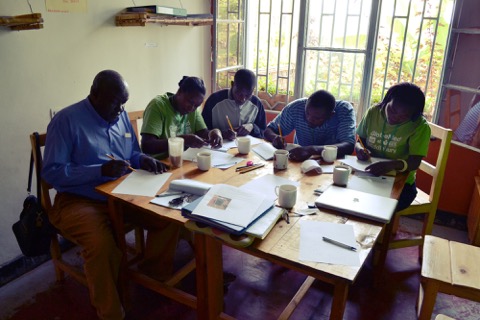
Featured Image: Gardens for Health International’s agricultural agents complete a mental mapping exercise in Ndera, Rwanda.
At Broad Street Maps, we believe that health is inherently a geographic issue. In the U.S. today, your zip code is a better predictor of your health profile than your genetic code. And in much of the developing world, where resources and infrastructure are limited, physical access to primary care can be the single most determining factor in the utilization of health services, and consequently, the health of a population. Therefore, the majority of the problems health workers face in these countries on a daily basis are inherently spatial. Resolving concerns about access to services and coverage, allocating limited resources effectively, and understanding the distribution of phenomena across a catchment area all depend on geographic knowledge.
The strength of local public health systems is inextricably linked to basic infrastructure. And being able to visualize that system as a whole — one made up of health centers and hospitals, water wells, bus stops, and marketplaces — is essential for delivering services to where they are needed the most.
Maps were used in public health since the 1800s
More than 150 years ago, Dr. John Snow, the father of modern epidemiology, and local community leader Reverend Henry Whitehead set out to investigate the cause of London’s raging cholera epidemic. The duo conducted interviews and gathered data points, going door-to-door to track the source of the epidemic. As their research progressed, Snow decided to map of the distribution of deaths in relation to Soho’s water sources. The map showed a trend — many of the deaths occurred around the Broad Street water pump or around businesses that used the pump’s water. Bolstered by his visualization, Snow insisted that the city remove the handle of the pump. After the pump was removed, mortality declined rapidly, forcing the medical community to consider, for the first time, the waterborne nature of the disease. Dr. Snow’s actions not only saved hundreds of lives, they also marked the first time that maps were used to directly influence public health policy.
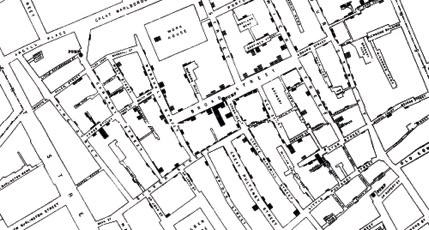
Snow, J. On the Mode of Communication of Cholera, 2nd Edition, 1855.
Opportunities and Challenges in public health mapping today
Today, maps and geographic analysis are being utilized in a myriad of ways across public health. They have, for example, been used to record distances that patients have to travel to get to the nearest tuberculosis directly observed treatment (DOT) distribution points, to quantify a relationship between the accessibility to roads and HIV cases, calculate population per bed ratios at local clinics, spatially analyze clinic usage, and evaluate and improve ambulance response times.
But despite their proven value, geographic tools remain extremely underutilized in the field of public health. Anyone who has ever interacted with a geographic information system (GIS) can probably guess why. The software is incredibly complex and time-intensive. It requires either a trained staff member or a significant investment in consultation. And most significantly in the developing world, it requires complete and accurate geographic data.
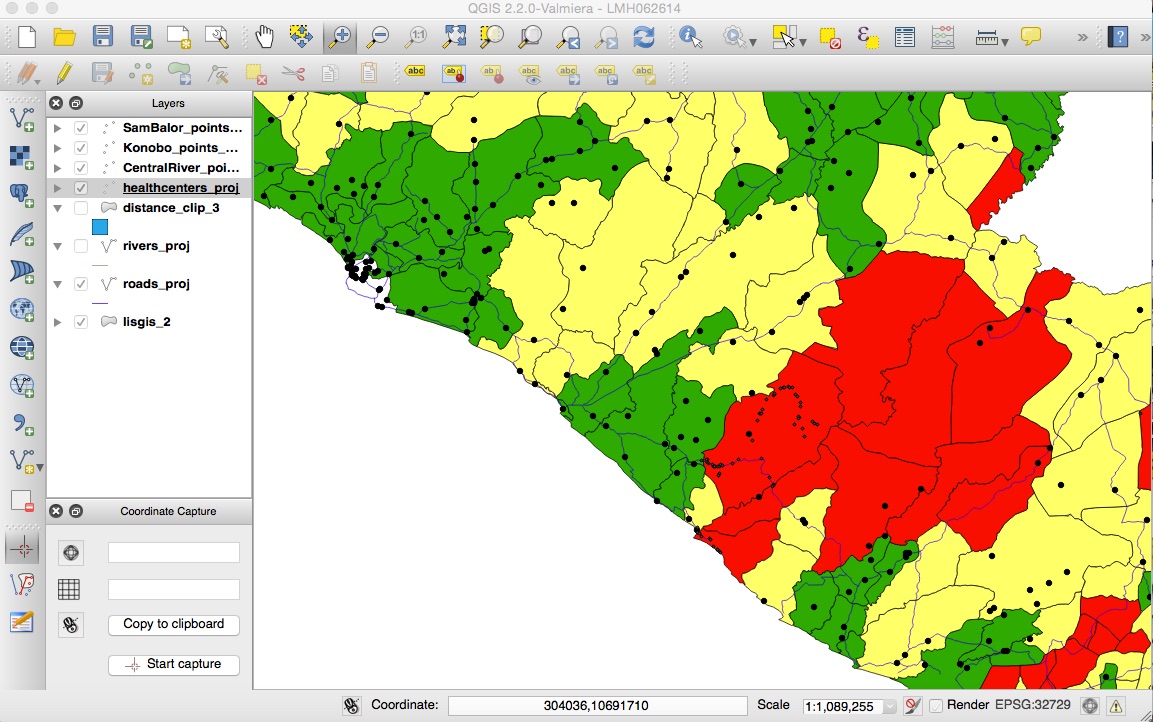
Analysis of the distribution of health centers performed in QGIS
Luckily, the proliferation of GPS-enabled smartphones is beginning to simplify the process of collecting and building upon this fledgling geographic data infrastructure. Tools like Magpi and ODK Collect allow users to update health surveys with the simple addition of a ‘Location’ field, thereby putting in place the essential building blocks for geographic analysis without exorbitant time, training, or cost. At the same time, Quantum GIS (QGIS) is offering a free and open source alternative to the close-source giants. And new platforms like CartoDB are making game-changing strides towards making web maps and geographic analysis more accessible.
But possibly the biggest obstacle to adopting these tools is a lack of roadmap on how to truly integrate geographic analysis into existing workflows. Smaller-scale organizations with limited bandwidth don’t have time to invest in new systems that don’t directly make their lives easier. Far too much ICT4D ends up being a burden. What we need are tools that streamline the process of analysis to decision-making. What we need are maps for action.
A Place to Start
Fortunately, organizations do not necessarily need to dive into software licenses and new tech to begin making action-oriented, spatial decisions. Hand-drawn maps have proven to be incredibly valuable tools for incorporating local knowledge, enhancing community ownership, and understanding local perceptions of distance and space. As Dr. John Snow and Reverend Henry Whitehead demonstrated, visualizing pertinent health data in even the simplest ways can elicit valuable new insights that inform future decision-making. And maybe even more importantly, the duo also proved that the grassroots process involved in understanding your “where” can be essential to developing a sound, and possibly life-saving, theory of “why.”
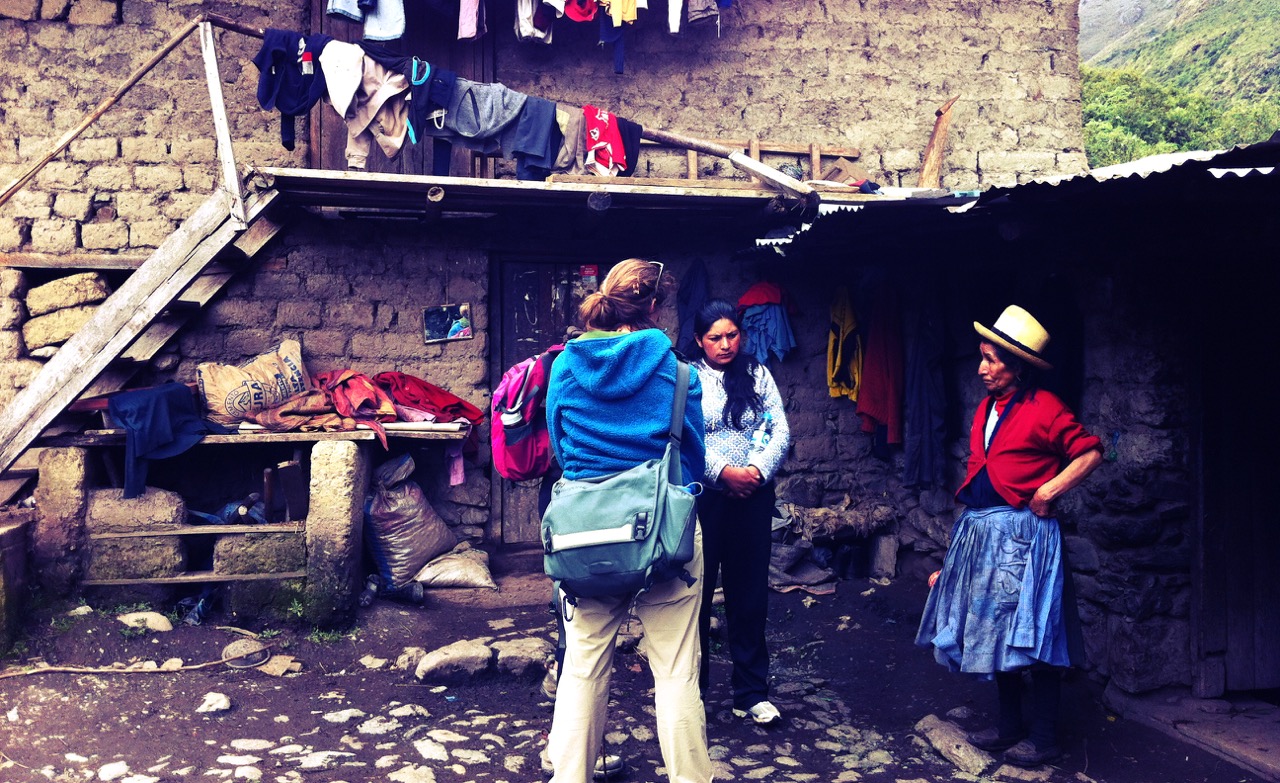
Broad Street Maps helping to conduct a household survey and collect GPS locations of patients in the Sacred Valley of Peru
Inspired by both the lessons from London and our time in the field, our team at Broad Street Maps is committed to leveraging the power of maps to visualize information, identify patterns, and, above all, actively use this vital perspective to make decisions.
If you are interested in learning more, have any questions, or are just head over heels about maps, please shoot us a line at contact@broadstreetmaps.org. Our team is always happy to provide guidance to organizations interested in mapping at all stages of the process.
If you are passionate about mapping development data, take a moment to check out the incredible work being done in the OpenStreetMap, the Humanitarian OpenStreetMap, and the Missing Maps communities.
And lastly, for a true immersion experience, be sure to check out TechChange’s course on Mapping for Social Good. Course starts this week!
About Isabel

Isabel Shaw heads cartography and product development at Broad Street Maps. She has worked with Save the Children and National Geographic and lived in Rwanda and Argentina. She is a TechChange alumna and holds a BA in Geography with concentrations in Global Health and Spanish from Middlebury College. Shaw lives in Seattle, WA.
TechChange and Kurante are excited to kick off the 2014 ICT4Drinks series with a Back-to-School happy hour on Thursday, January...

When nerds and do-gooders get together, great things can happen. But what metric can adequately capture the importance of a...
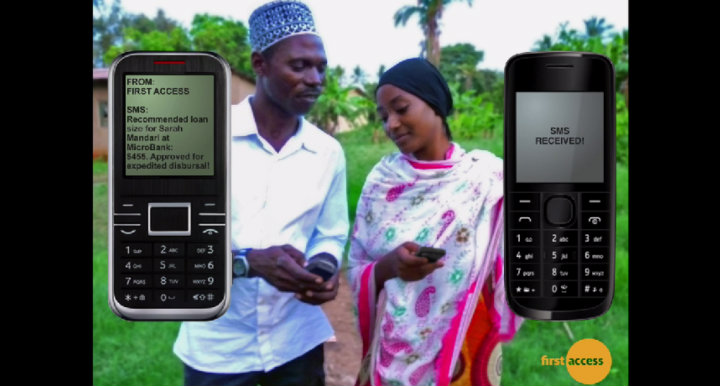
Photo credit: First Access In the fight against poverty, microcredit has been hailed as one of the most successful...